Your registration has been confirmed. Thank you for signing up!
In this lesson we will introduce the Sensu observability pipeline. You will learn about Sensu’s architecture, its underlying data model, and how its unique set of features can be used to implement a monitoring-as-code workflow within your organization.
This lesson is intended for operators of Sensu, or anyone who would like a short semi-technical introduction to Sensu.
There as many approaches to observability as there are software applications written. Perhaps more. Some are assembled from a mish-mash of glued-together services. Others are monolithic commercial platforms that attempt to do everything from polling the kernel, to storing each log line and every millisecond of system metrics, into massive vendor-specific data lakes.
Sensu takes a middle path in this milieu by providing a smooth pathway for observations to flow directly from their origins to any number of destinations. Using a flexible API-oriented approach, Sensu pipelines can chain many event-processing components together, in a model similar to UNIX pipes. These components filter, modify, and route the data, producing alerts, storing metrics, triggering automated remediations, and much more.
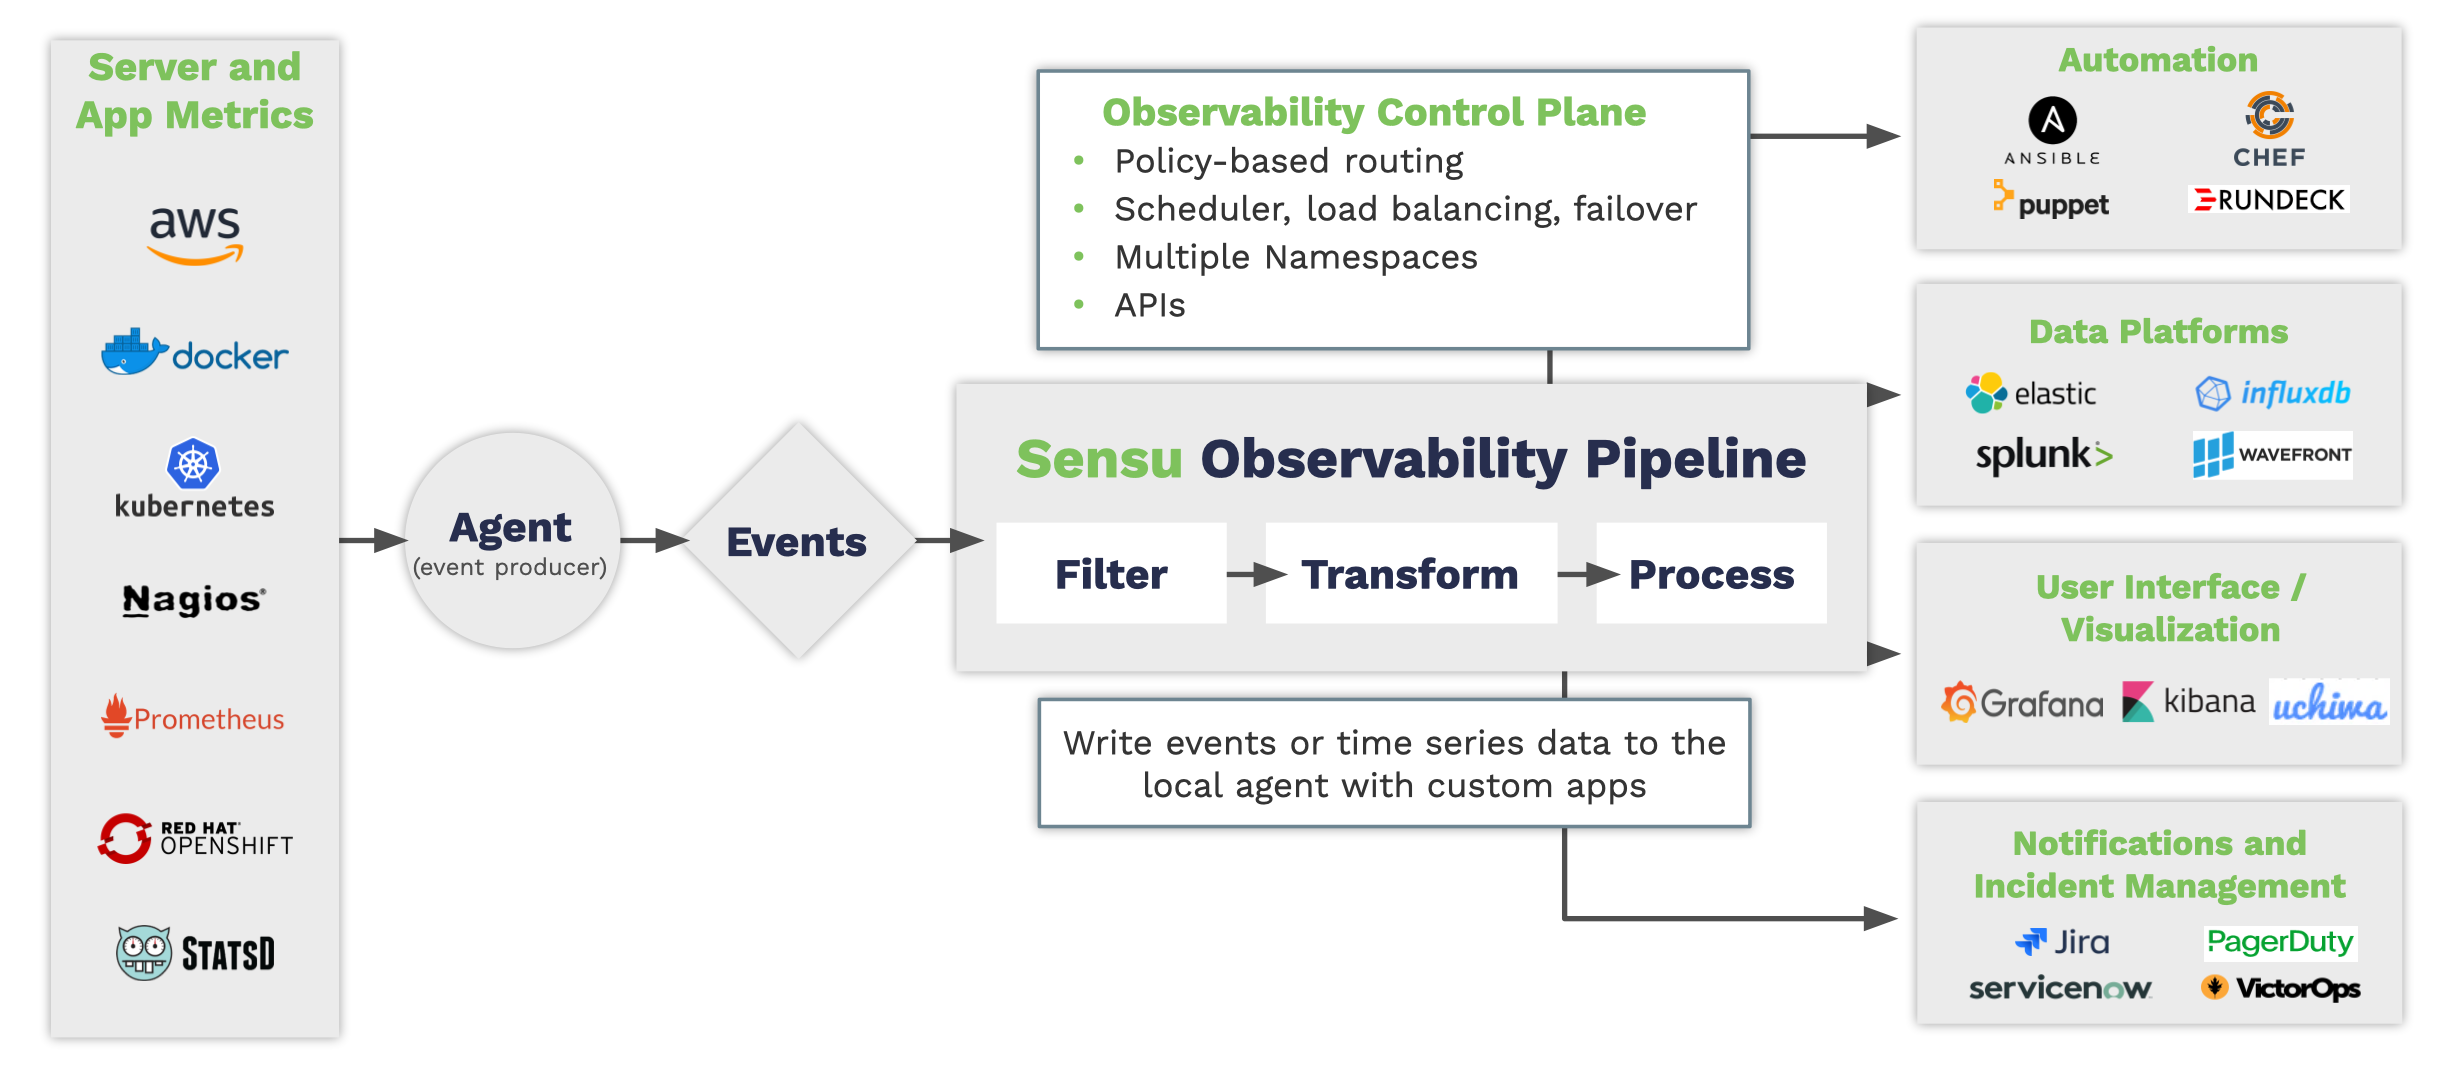
Within Sensu, everything starts with the agent. An agent is a sidecar process deployed alongside your code, which observes your running systems. It publishes events which pass through a customized pipeline that filters, modifies, and makes decisions about how to handle the events. Most importantly it uses the same kinds of conditional logic that you do.
Sensu provides an integrated pipeline with a consistent data model. Operating like a control-plane, Sensu’s event-driven architecture gives you a flexible means by which to direct multiple streams of observations and metrics to whatever destination you need them to go, and transforms them into whatever shape they need to be along the way.
It can do this because every observation in Sensu is contained in a single flexible data structure; the event.
Example: A Sensu Event Data Structure
{
  "metadata": {},
  "entity": {},
  "check": {},
  "metrics": {},
  "id": "xxxxxxxx-xxxx-xxxx-xxxx-xxxxxxxxxxxx",
  "timestamp": 1234567890
}
Events can contain numeric metrics, key-value metadata, labels, and annotations, as well as any other payload of information that is meaningful to your system. Each component in the pipeline expects a stream of events as input and outputs a stream to the next component.
Learn more about the event data structure in the events reference docs.
There is a strong movement towards managing all aspects of the software industry in the same way that we manage application code. Collectively these are referred to as “everything-as-code” methods.
Sensu is designed specifically to enable this kind of workflow for monitoring.
The Sensu backend is a service that provides the API and performs event processing. All aspects of the observability pipeline can be modified at runtime through the API. Operators can add new service monitors, modify the behavior of filters and handlers, silence noisy streams of data, or add new data-platform sinks at any time, without the need to re-deploy.
Monitoring configurations are defined in either YAML or JSON files, which are pushed to the API to build the pipeline. These configuration files can be stored in source-control alongside your application code, and can be tested, versioned, and managed like any other code file. This workflow takes the burden off of system operators, by allowing engineers to self-service their monitoring configurations, with security and access controls at every layer.
To learn more, please check out our monitoring as code whitepaper.
Another essential component of Sensu is the runtime asset – shareable, reusable packages that make it easy to dynamically deploy monitoring plugins.
Sensu hosts a public repository of commercially- and community-supported assets called Bonsai. This service provides real-time distribution of assets to agents and backends based on the monitoring configuration. Operators and developers can stay focused on the monitoring configurations, without worrying about how to securely deliver monitoring plugins to the edge.
There are hundreds of open-source plugins available on Bonsai, supporting nearly every imaginable integration. Have a look around! If what you need isn’t already available, the Sensu Plugin SDK makes it easy to develop and publish new custom plugins.
In this lesson we covered the basics of Sensu’s architecture, data model, and monitoring-as-code workflow. The rest of the workshop is a series of hands-on exercises that walk you through some of the essential features of Sensu, in a sandboxed environment.
sensuctl and Config Files The description above might seem somewhat complicated. But the beauty of Sensu is that these features are built into the platform, so you don’t have to worry about them.
As an operator, the majority of your time interacting with Sensu is spent editing YAML/JSON configs, and running high-level commands from a command-line shell. The Sensu user-experience is simple, consistent, and makes it easy to manage complex environments without being overwhelmed with details.
Sensu is designed to be an ideal balance between flexibility and structure.
As an intellectual exercise, consider the following questions about your previous monitoring system:

Made with #monitoringlove by SensuTM in Canada 🇨🇦 and the USA 🇺🇸. © 2017-2021 – Privacy Statement – Terms & Conditions