Your registration has been confirmed. Thank you for signing up!
A comprehensive “everything as code” initiative should incorporate monitoring and observability. In this whitepaper, we’ll examine how monitoring as code fills that gap.
Adopting monitoring as code means extending the cultural expectations around repeatability, safety, and velocity in application development and infrastructure automation to monitoring and observability. The way we observe and operate our systems after they are deployed should be managed the same way we build, test, and deploy those same systems: as code.
Continuous Integration and Continuous Delivery (CI/CD) have drastically changed the way companies build and deliver products and services. With the advent of DevOps, infrastructure as code (IaC), and containerization, infrastructure and IT management have become decentralized. Now, organizations can be more agile, delivering more business and customer value faster. CI/CD, configuration management, infrastructure as code, and cloud computing all came out as tooling to facilitate that high-velocity change, but — until recently — monitoring tools were still reacting to the changes in the modern IT environment.
"Monitoring as code solves a bane for many projects whereby unexpected issues during pre-production testing or deployments go undetected. We lose hours allowing failing tests to continue, then more time troubleshooting the problem, and of course, we miss the opportunity to investigate root cause at the point of failure. With monitoring deployed alongside the application via a single, unified pipeline, we catch any issues early and avoid having to manually babysit the testing and CI/CD process.”
– Seng Phung-Lu, AVP Site Reliability Engineering, DevOps Tools Engineering, and Cloud Monitoring at TD Bank
The key difference between traditional monitoring workflows and monitoring as code can be distilled down to a single concept: what we do with monitoring and observability data is even more important than how we collect it. We would never leave the instrumentation of our applications and services and collection of monitoring and observability data up to some opaque external workflow, out of band of our core application delivery pipeline. Monitoring as code differentiates itself from traditional workflows by helping IT organizations make better decisions.
A comprehensive “everything as code” initiative should incorporate monitoring and observability. In this whitepaper, we’ll examine how monitoring as code fills that gap.
“Everything as code” strategies are being adopted by industry leading organizations as a key element of Digital Transformation initiatives. In most of these organizations, “as code” practices were already commonplace in Engineering; as these changes improved engineering velocity, it then became desirable to adopt these practices in other parts of the organization, including IT operations. When adopting “as code” practices in IT and beyond, we encounter both the greatest challenges and rewards.
The IT operations world has seen a LOT of change over the last 10-15 years. Although it’s now quite common to find Continuous Integration and Continuous Delivery (CI/CD) pipelines in most IT organizations, they are still a relatively new concept. Continuous Integration[1] has only been around since the 1990s, and for over a decade CI was only thought of as a development tool for building and testing applications, not as a framework for automating other operational concerns.
Everything changed around the time of John Allspaw’s 2009 talk, “10+ deploys per day”[2], and Jez Humble and David Farley’s 2010 book, Continuous Delivery[3]. We realized we could do a lot more with CI than just build and test application code – we could also automate parts of the release and deploy process… and thus, the CI/CD pipeline was born.
Before we knew it[4], the term “infrastructure as code” (IaC) entered the vernacular and became a major foundational element of the DevOps movement, allowing developers and operators to increase velocity while improving repeatability, reliability, and maintainability. As Sensu CTO Sean Porter has said previously, by codifying your infrastructure and application deployment in the same way, you establish one framework — one source of truth — for the state of configuration for everything from your infrastructure to your applications. Managing infrastructure as code meant we could integrate infrastructure into this new CI/CD pipeline.
Although “everything as code” has become the status quo among leading IT organizations adopting DevOps and SRE practices, many operational concerns have lagged behind the advancements made in application and infrastructure delivery – monitoring and observability primary among them. The challenge facing these enterprises is how to close the growing gap between the parts of the application lifecycle that are being managed “as code” and the ongoing management of these same applications.
How can enterprise IT teams catch up?
At its core, monitoring as code is about one thing: closing the loop in the application lifecycle and aligning development and operations around a single unified workflow. When everything is code, there’s no such thing as a bad alert – every observation becomes actionable in the form of a code change and new release.
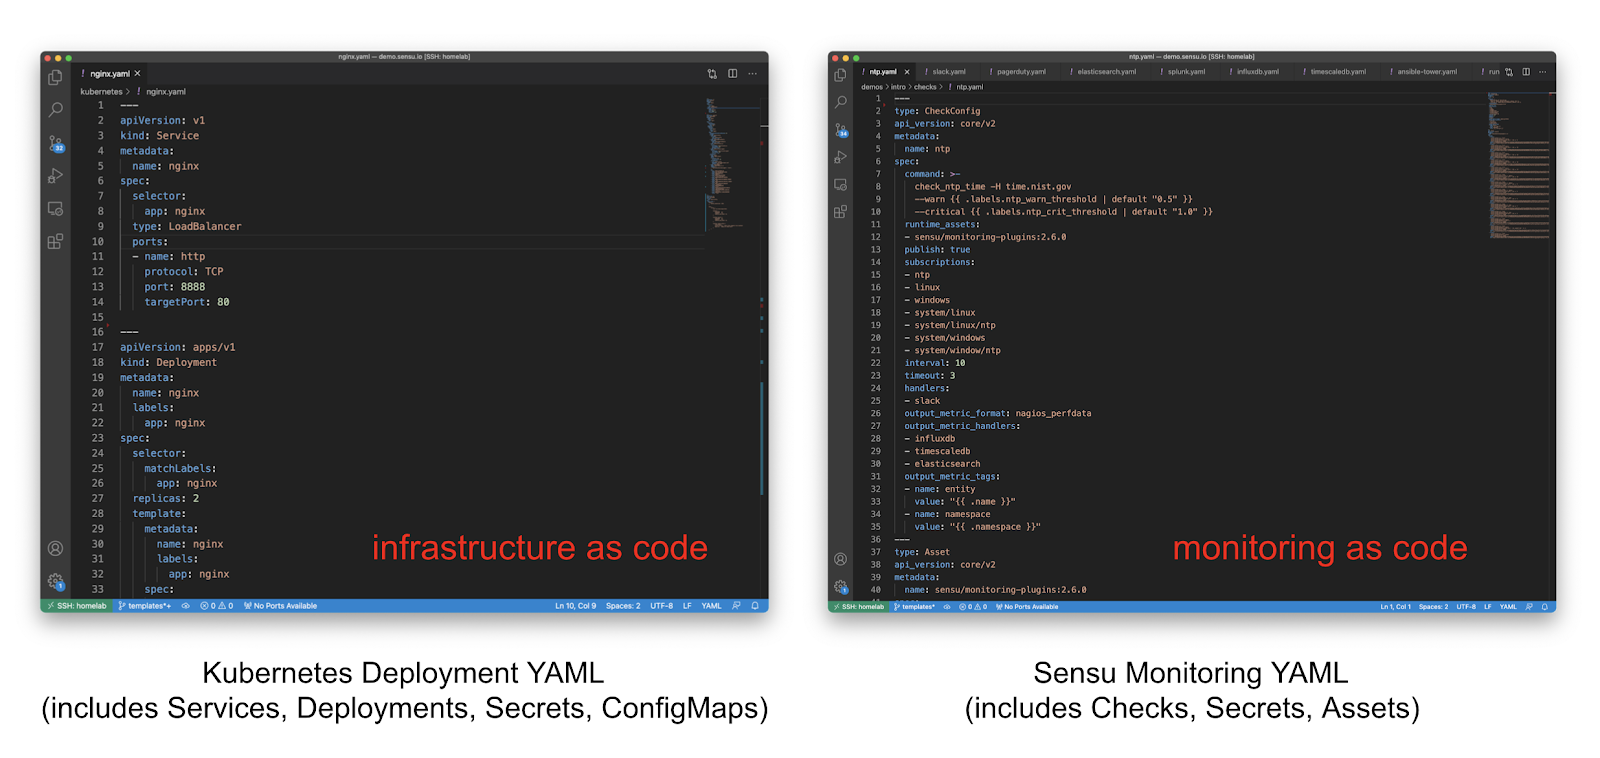 Figure 1: Side-by-side comparison of modern infrastructure code and monitoring code.
The term “monitoring as code” isn’t new by any means, but most existing references to monitoring as code typically describe monitoring automation as part of a larger infrastructure as code initiative – automated installation and configuration of agents, plugins, and exporters. While this a great starting point, it is not a complete end-to-end solution. Monitoring as code encompasses the entire observability lifecycle, including automated diagnosis, alerting and incident management, and even automated remediation.
“Most of the existing options for monitoring as code are limited to data collection configuration; they lack the ability to codify the reactive logic and automation that you get from tools like Sensu.” — Principal Software Engineer @ Fortune 1000 fintech organization
A comprehensive monitoring as code strategy should encompass the following:
Monitoring as code also shares traits common to other code workflows, specifically including the incremental nature of adoption. Practices like test-driven development (TDD) or infrastructure as code don’t need to be implemented to completion before they can be promoted to production. In fact, many organizations never reach 100% test coverage or 100% automation coverage! Likewise, monitoring as code is adopted over time. Most monitoring as code initiatives start with one use case – which can then be released as “version 0.1” – and expand to others over time.
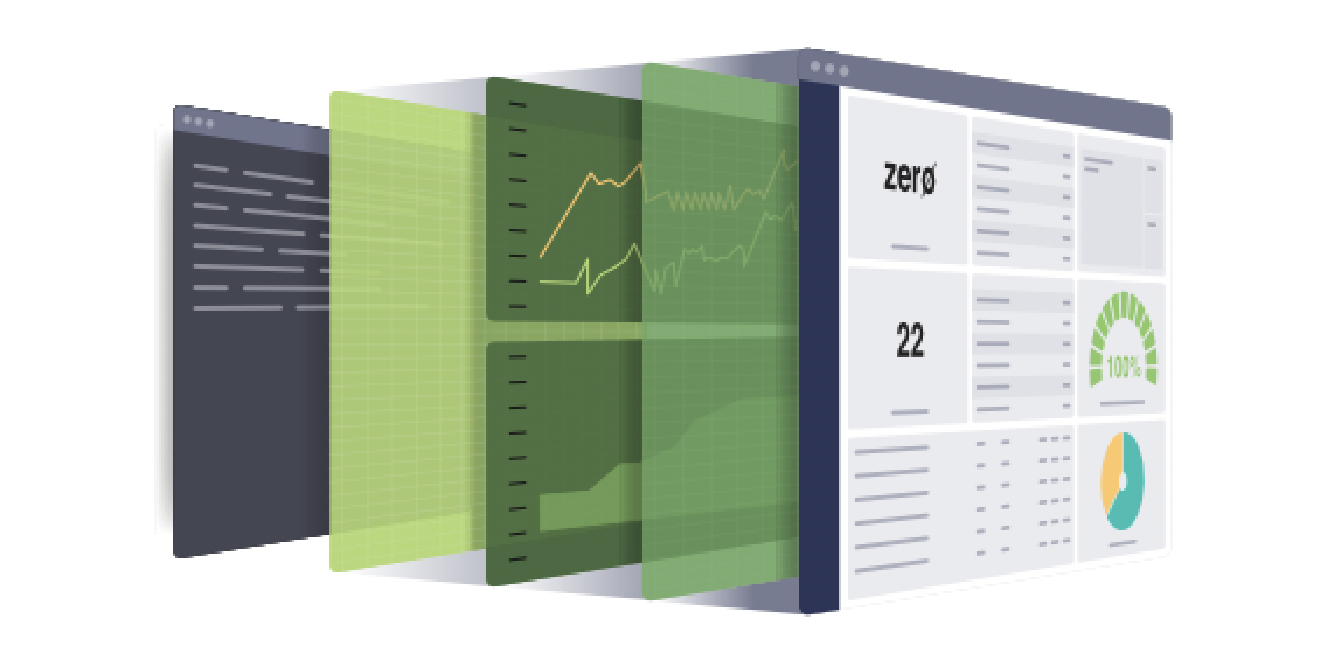
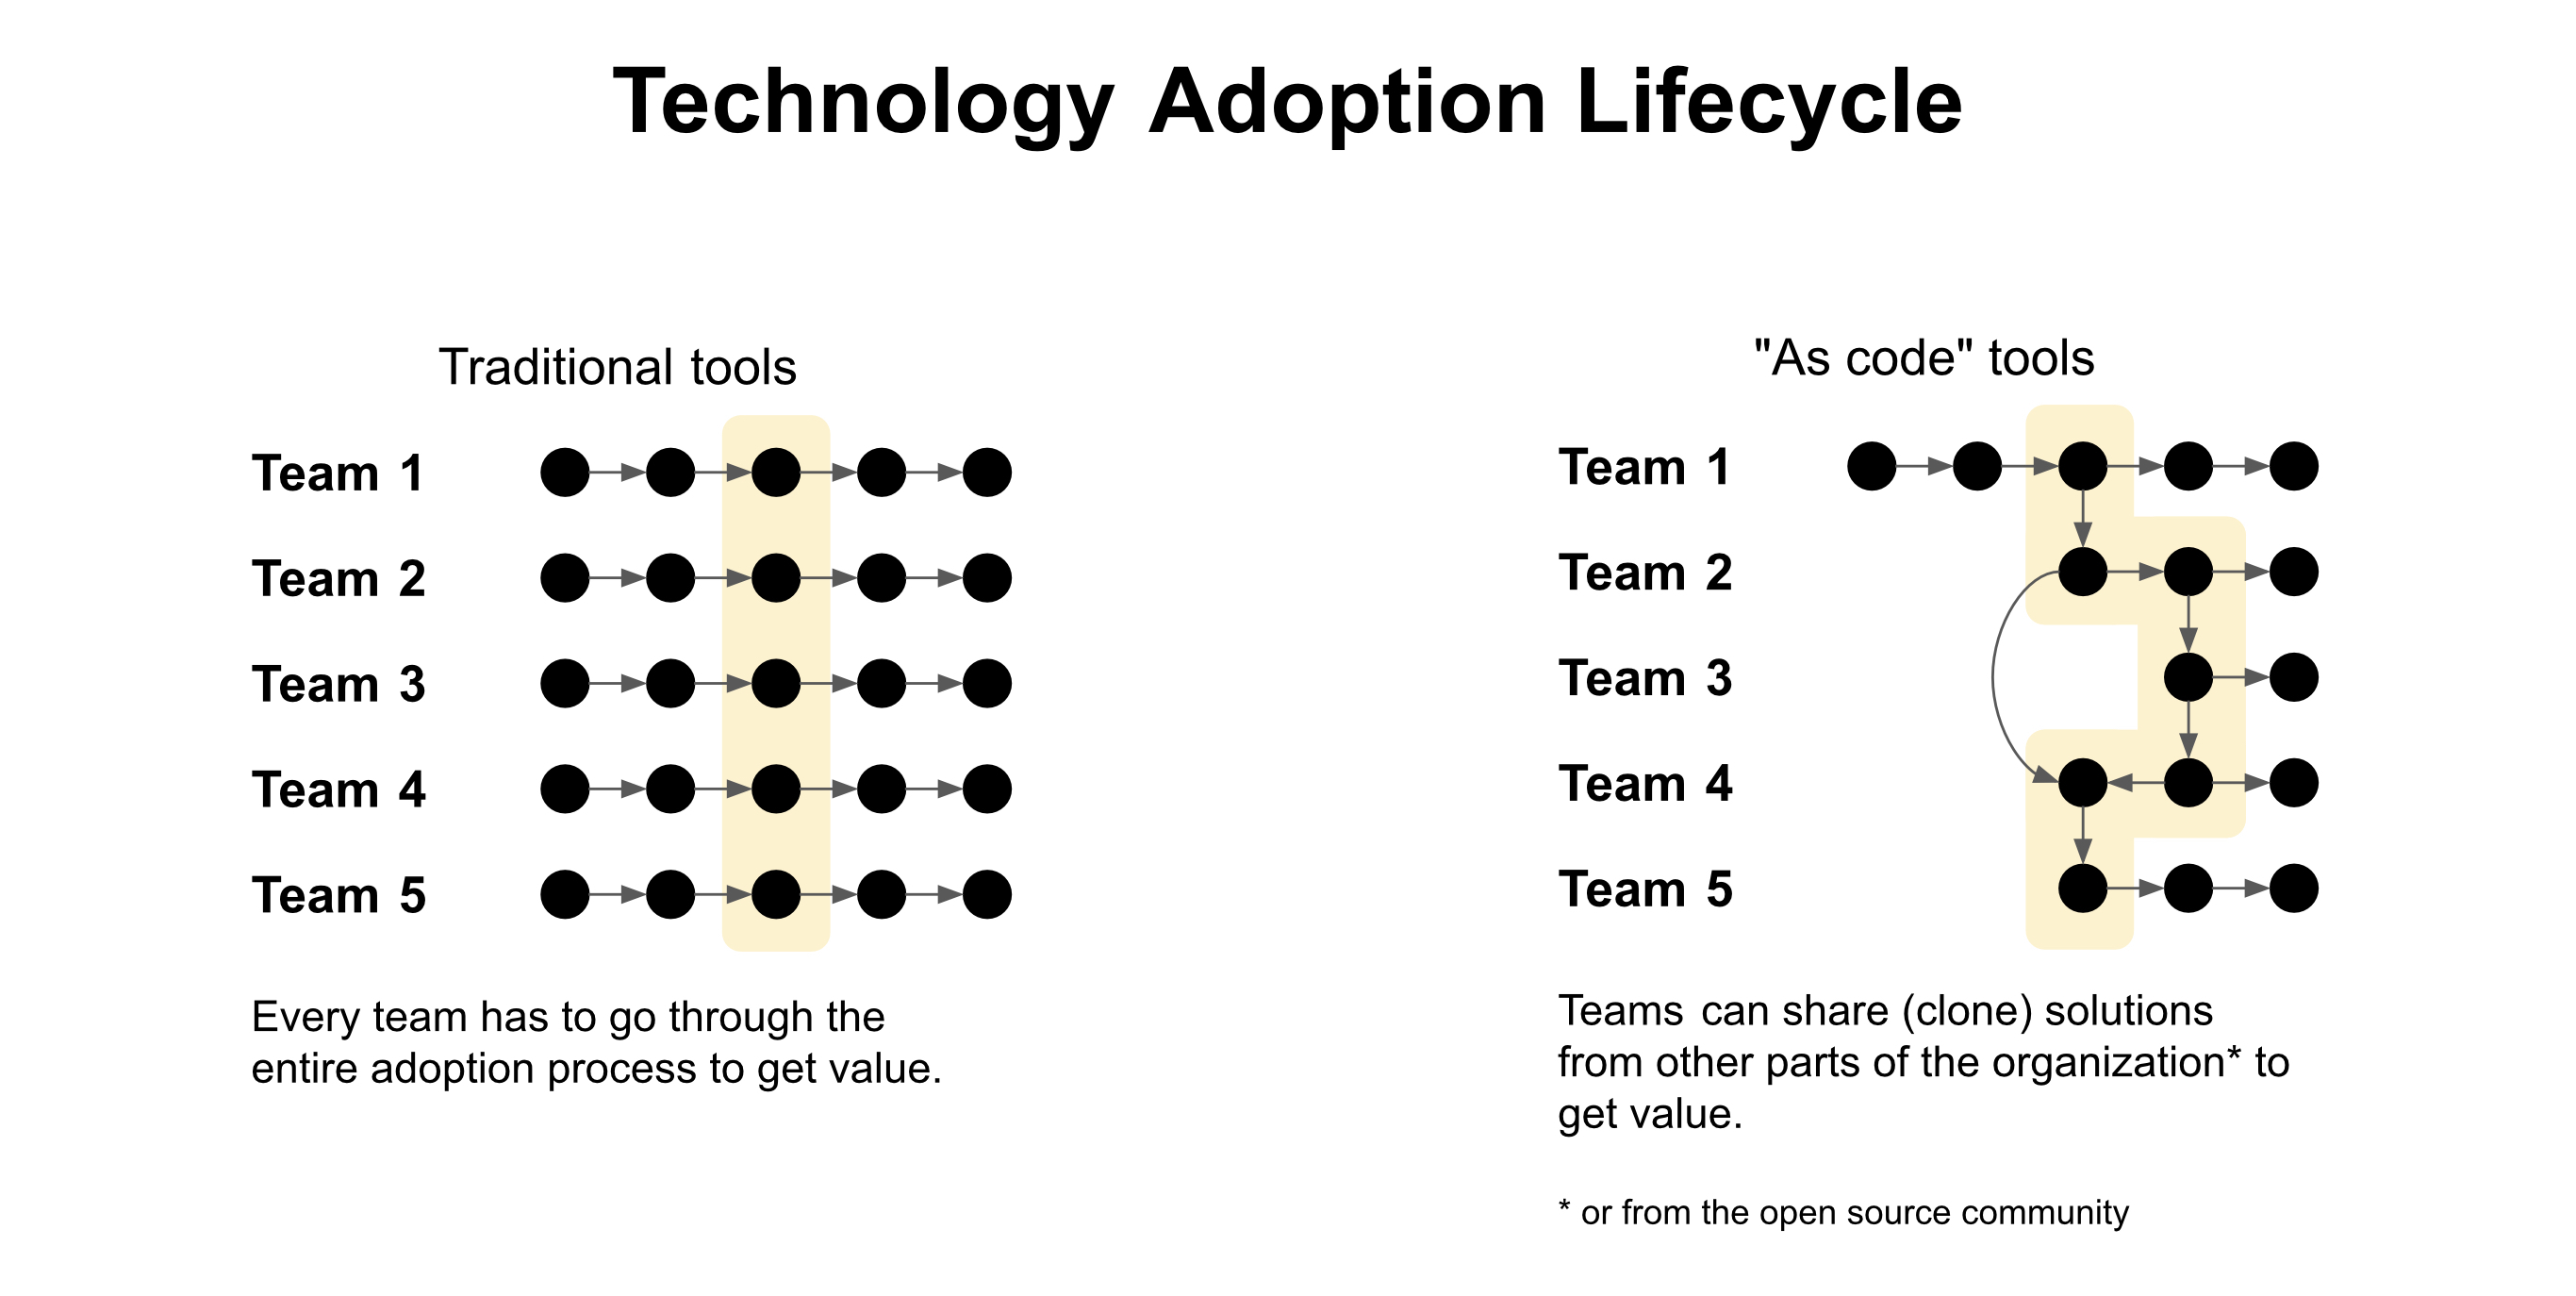 Figure 2: With monitoring as code, you get declarative configuration files that can be shared amongst team members, treated as code, edited, reviewed, and versioned.
Monitoring as code initiatives can also start off as a relatively “low code” implementations by reusing existing skills (e.g., familiarity with existing plugins and data platforms), or by bootstrapping deployments using example templates[5] that can be modified by tuning simple configuration flags. This low barrier of entry is possible due to the nature of the tools used to enable monitoring as code, which will be discussed in the following section.
Everything as code initiatives as we know them are built on top of pipelines that enable organizations to codify complex business requirements as repeatable steps. The CI pipeline (build+test) paved the way for Continuous Delivery (CD). Together as the CI/CD pipeline (build+test, deploy), they provided the foundation for infrastructure as code (build+test, provision+test, deploy). Like IaC, monitoring as code hooks into this CI/CD pipeline, but also requires a dedicated pipeline for ongoing observation of our systems (build+test, provision+test, deploy, observe). We call this missing link the observability pipeline.
| Continuous Integration (CI) | Build (+Test) |
| CI/CD | Build (+Test), Deploy |
| Infrastructure as Code | Build (+Test), Provision (+Test), Deploy |
| Monitoring as Code | Build (+Test), Provision (+Test), Deploy, Observe |
Sensu is an observability pipeline that enables monitoring as code on any cloud.
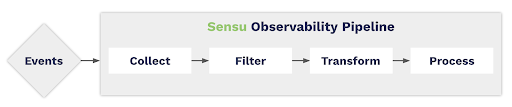 Figure 3: The core engine of the Sensu Observability Pipeline provides
necessary building blocks for codifying complex observability workflows.
Figure 3: The core engine of the Sensu Observability Pipeline provides
necessary building blocks for codifying complex observability workflows.
The Sensu Go observability pipeline provides a turn-key solution for monitoring as code, including the following benefits:
Developer- and operator-oriented interfaces. Sensu Go’s observability pipeline is the monitoring as code command center (control plane), providing a variety of code-based interfaces for development and operations teams to interact with, including: RESTful HTTP APIs, a comprehensive CLI (sensuctl), and declarative configuration files.
Designed for self-service workflows. Sensu Go supports multi-tenancy via namespaces and RBAC, enabling self-service access to monitoring as code. Because Sensu solutions can be shared amongst team members, treated as code, edited, reviewed, and versioned – new teams are able to get up and running without starting the technology adoption lifecycle from scratch (e.g., evaluation, deployment, and training).
End-to-end solution. Sensu provides a complete end-to-end solution for monitoring as code.
The typical journey to monitoring as code for most organization follows four major milestones:
Integration. The observability pipeline provides an integration layer between the existing “as code” tooling and services (e.g., CI/CD pipelines, multi-cloud compute APIs, secrets management providers, and certificate management systems), and existing systems of record. Sensu’s built-in integrations make reaching this milestone a matter of simple configuration. Once the required integrations are connected to Sensu, the organization can immediately begin iterating on versioned monitoring code, unifying the development, IT, and security teams around a shared workflow while automating deployment of improved visibility at scale.
Standardization. Identify existing instrumentation interfaces used by the various monitoring and observability tools which can be consolidated into the unified pipeline. This includes Nagios-style monitoring scripts, applications instrumented with StatsD/DogStatsD, /healthz API endpoints, Prometheus exporters, Telegraf metrics, and many more.
Acceleration. Packaging of common monitoring and observability business requirements as declarative monitoring templates enables accelerated adoption across additional business units.
Innovation. By closing the everything as code loop in the application lifecycle, development, IT, and security teams can collaborate on core business improvements via a unified workflow.
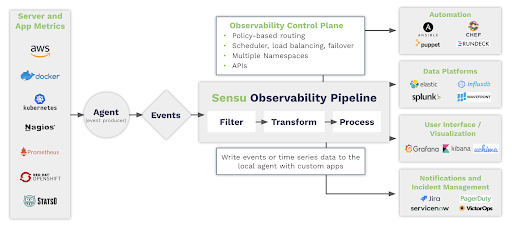 Figure 4: The complete Sensu Observability Pipeline provides additional value around the core engine / building blocks.
Embracing monitoring as code principles and deploying an observability pipeline are great first steps towards complete visibility into your mission-critical infrastructure — but without a repeatable process, it may be hard to grow adoption. Although there’s no one “correct” workflow for implementing monitoring as code at every company, an “over the counter” reference is available to help you get started, and we call it “SensuFlow”. Together, SensuFlow and Sensu Go provide the process and tools to ensure successful outcomes for any monitoring as code initiative.
“I need a [monitoring] strategy that I can rally people around and deliver against.” — CIO at a Fortune 100 tech company
SensuFlow is the result of years of extensive research, product development, integration testing, and end-user feedback collected from over 50 companies ranging from SMBs to industry-leading enterprise organizations with tens of thousands of nodes under active management by Sensu.
How it works:
Deployment automation. Get up and running with Sensu Go in minutes[6] thanks to supported integrations with popular configuration management solutions including a partner-certified Puppet module[7] and Ansible Collection. Official Sensu downloads are available for Docker, or via package repositories (YUM, APT, and Chocolatey), installers (RPM, DEB, and MSI), and binary archives. Please visit the deployment guide or our downloads page for more information.
Direct integration with CI/CD providers. sensuctl, the Sensu Go CLI, provides built-in support for unattended operation (e.g., shell scripting), making it easy to integrate in any CI/CD platform. A turn-key reference implementation is currently available for GitHub Actions, with support for other CI/CD platform marketplaces coming in H2’21.
Built-in configuration pruning. The Sensu prune API (and sensuctl prune command) provide built-in support for keeping the running monitoring configuration in sync with the monitoring code.
Label-based workflow facilitates self-service access to monitoring as code. Because Sensu Go was designed for multi-tenancy and self-service – thanks to built-in support for namespaces and RBAC – it becomes very simple to implement multi-tenant monitoring as code workflows on top of the Sensu platform. SensuFlow can be applied to multiple application code repositories and their corresponding CI/CD pipelines, all integrated with a shared Sensu Go deployment. Thanks to the underlying support for label selectors in the Prune API, multiple disparate teams can create, modify, and remove monitoring code without inadvertently impacting product neighboring teams and services.
To learn more about SensuFlow, check out this blog post from our Developer Advocates.
Over the last 10+ years, CI/CD became the foundation for how we build, test, and deploy our infrastructure and applications. Over the next 10 years, we’ll see the rest of the application lifecycle – specifically monitoring and observability – managed as code and integrated into this same pipeline.
Adopting monitoring as code as a strategic initiative unlocks improved operational velocity. The best news is, reaching your organization’s monitoring as code goals is possible thanks to a battle-tested formula of people + process + tools:
People: rally around a common set of “as code” skills. Reuse existing skills – including familiarity with CI/CD workflows and compatible monitoring tools – to get started quickly. Monitoring as code can be employed for a single use case (released as “version 0.1”) and expanded over time.
Process: align teams via a unified workflow. Aligning development, security, and operations teams around a single unified workflow (everything as code) yields immediate results. IT teams can shift their focus on getting better alerts – 100% actionable as revision-controlled code changes and new releases – instead of falling into the trap of setting goals around fewer alerts. Companies that practice monitoring as code are able to invest recovered engineering resources toward innovation that drives topline growth in the organization, rather than mere avoidance of downtime.
Tools: extend the benefits of CI/CD to monitoring via the observability pipeline. Last but not least, the critical third component in monitoring as code is the centralized observability pipeline, which facilitates codification of the end-to-end monitoring solution from data collection through automated diagnosis and remediation. Thanks to turn-key observability pipelines like Sensu Go you no longer need to build a bespoke solution from the ground up – monitoring as code is a truly attainable goal.
To learn more about monitoring as code – including practical monitoring as code with Sensu Go and SensuFlow – sign up for our on-demand webinar.

A term first proposed by Grady Booch in his 1991 publication, Object Oriented Design: With Applications ↩︎
10+ deploys per day. Fun fact: Patrick Debois was inspired so much by this “10+ Deploys per Day” talk that he was motivated to launch the inaugural “DevOpsDays” conference in Ghent, Belgium in the fall of 2009. ↩︎
Thanks to the growing popularity of configuration management tools (Puppet launched in 2005 and Chef in 2009), the terms “DevOps” and “infrastructure as code” (IaC) entered our vocabulary. ↩︎
Sensu Go is supported on Linux (Intel, ARM, MIPS), Windows, MacOS, and Unix (BSD, AIX). ↩︎
The Sensu Puppet module is one of the top 50 most popular Puppet modules of all time, with over 3M downloads. See: https://forge.puppet.com/modules/sensu/sensu. ↩︎

Made with #monitoringlove by SensuTM in Canada 🇨🇦 and the USA 🇺🇸. © 2017-2021 – Privacy Statement – Terms & Conditions