The summer of 2022 is a strange time to be attending a tech conference. The “Pandemic Pause” has left us all hungry for connection and a little awkward about it.
While the world is largely returning to a semblance of comfort with larger public events, COVID is still a real and present threat, something we keep in the backs of our minds all the time. But having a sense of community is also important and so, we weigh the risks — go another year without collaboration and connection — or take sensible precautions, cross our fingers, and accept the risks of a large indoor gathering? For the hundreds of people who showed up at Monitorama in the Armory Theater on June 27th, we all made the same choice, for better or for worse.
The atrophy of our social-skills was palpable. Hallway conversations were less fluid than they have been in the past. However, if you broke through the new-normal of hyper-introversion, and actually said hello to someone, they seemed very eager to talk — perhaps even over-eager, though a little unsure how to proceed. The year, Sumo Logic joined the conference as a platinum sponsor. While both Sensu and Sumo Logic have been sponsors in the past, this was the first Monitorama where we combined forces in our commitment to open source and driving deeper engagement with the developer and DevOps communities. For my part, I spent my time at the conference listening and trying to chat with as many people as I could. From this, I was able to gain some insights into the current state of monit-observa-trac-ability.
COVID-19 in 2022
But first, let’s talk about the little lipid-encased elephants floating around the room. Anyone who can read a chart knows this is still a huge concern, perhaps more now than ever, as society grows increasingly comfortable with the risk and increasingly lax at responding to it. The conference took a middle path towards managing COVID:
- Proof of vaccination was required.
- Masking was required indoors at all times — and if you forgot yours, free masks were available at the door.
- The main stage was live-streamed for those who didn’t feel comfortable attending in person.
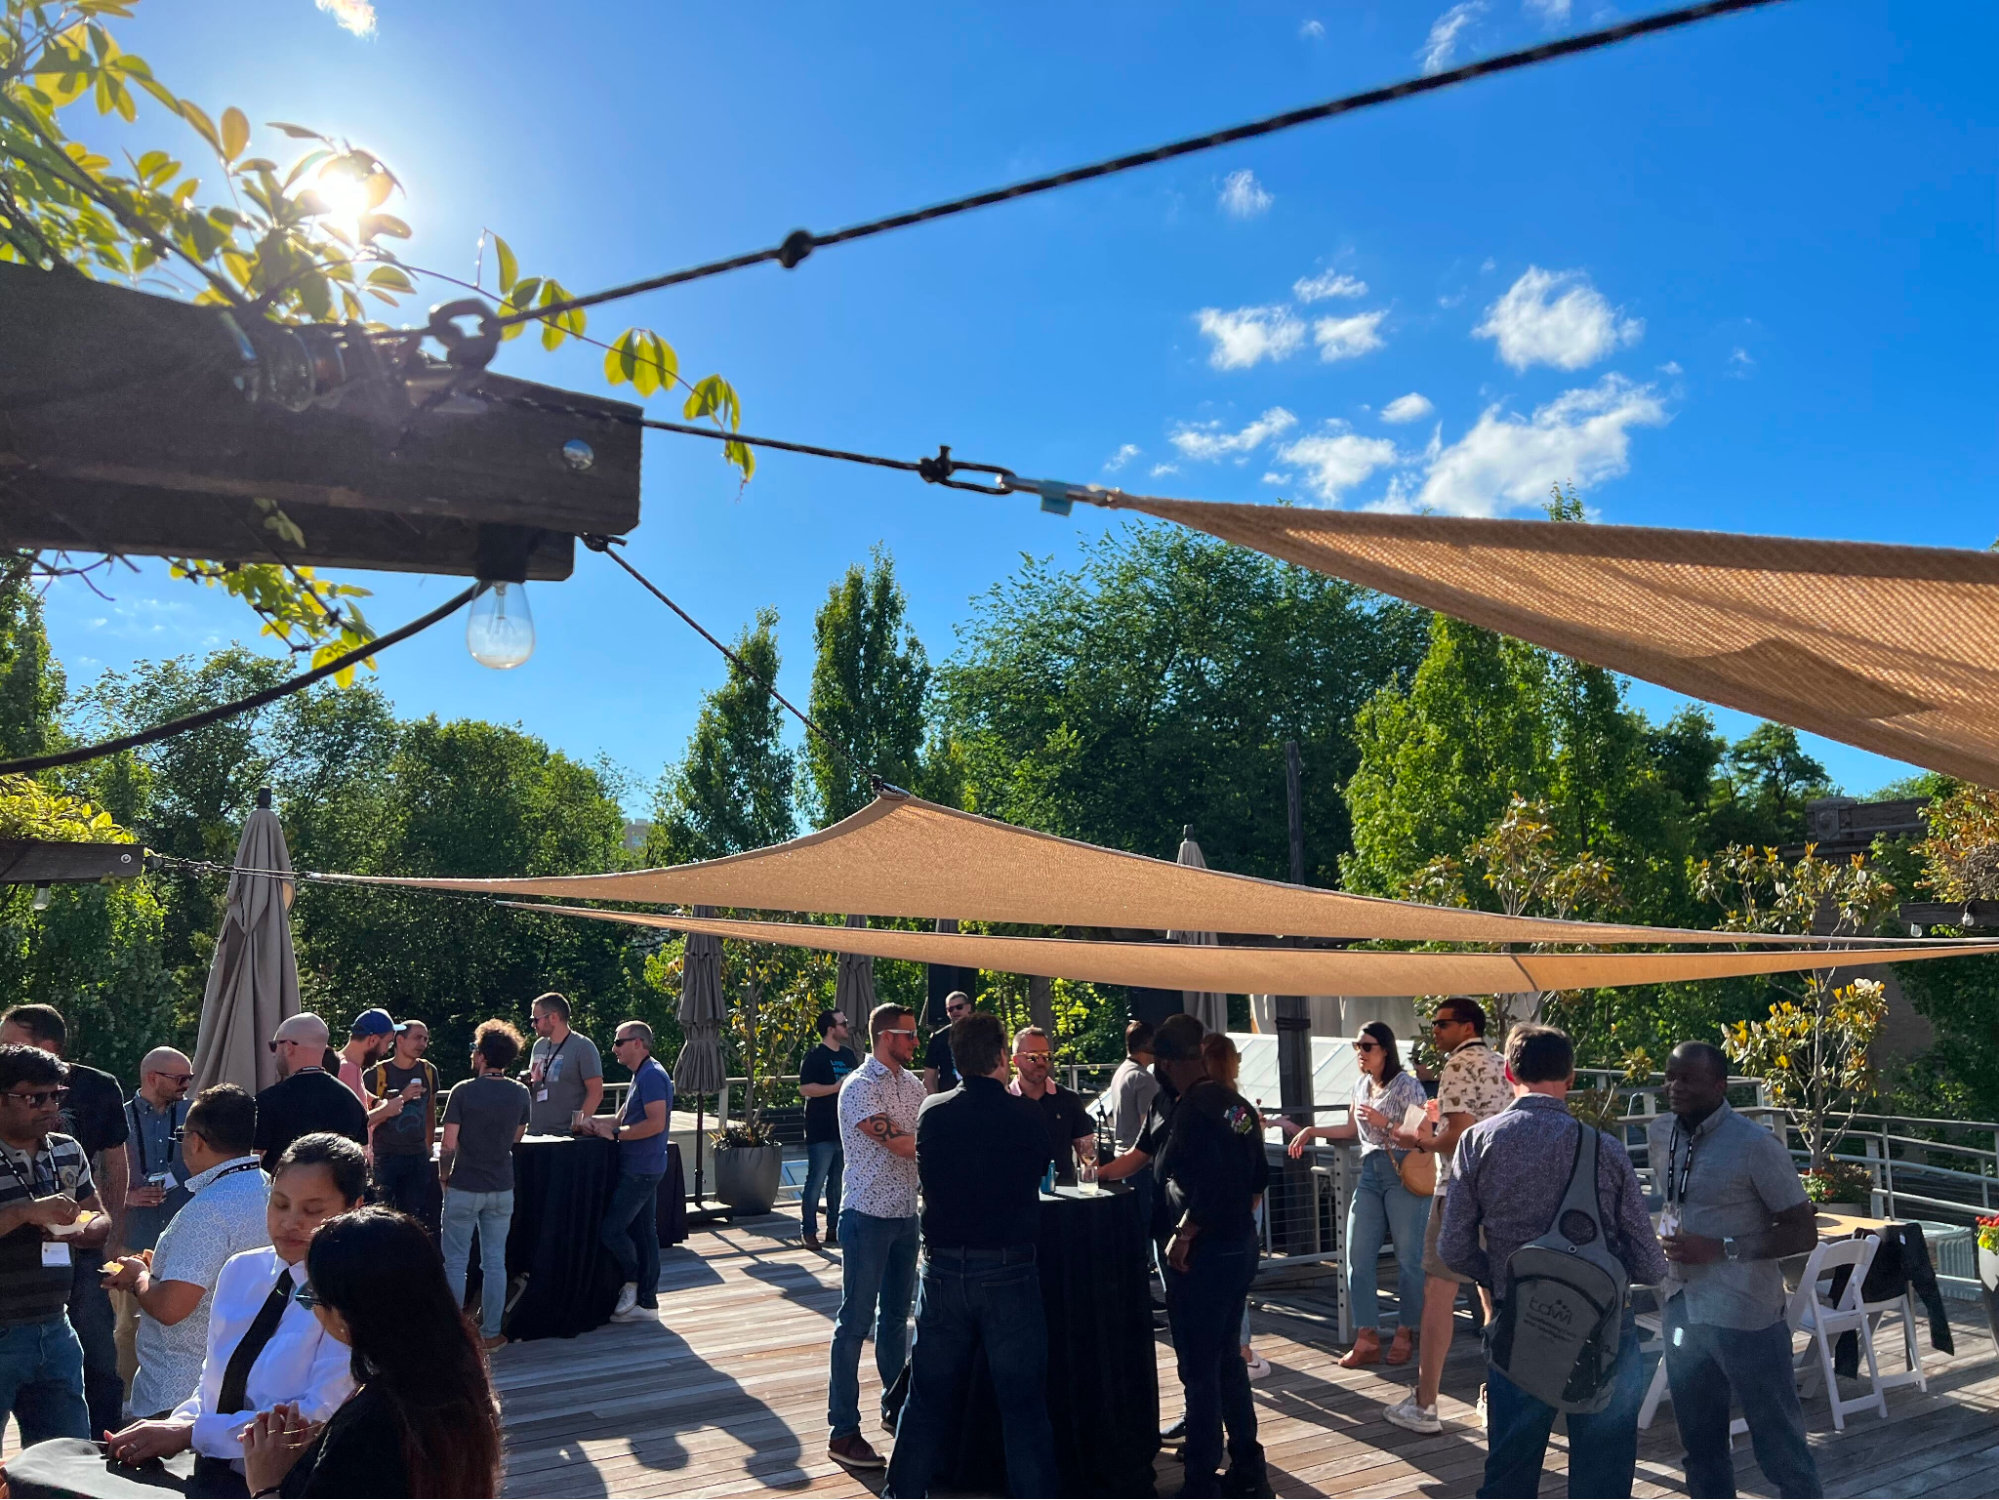
- Official after-parties were mostly held in locations with large outdoor spaces (and sometimes chickens).
Our community of observability professionals is uniquely suited to reading charts and evaluating risks based on that data. Personally, I’d love to see the risk-modeling notes that folks used when evaluating whether or not to attend this year. My co-worker Jef Spaleta, visiting from Alaska, brought a portable continuous carbon dioxide meter with him. Using indoor-CO2 accumulation as a measure of “how well ventilated the space is”, and as a proxy for “how likely is it that a viral load is lingering in the air”, this device gave him a constant stream of metrics about his personal level of risk.
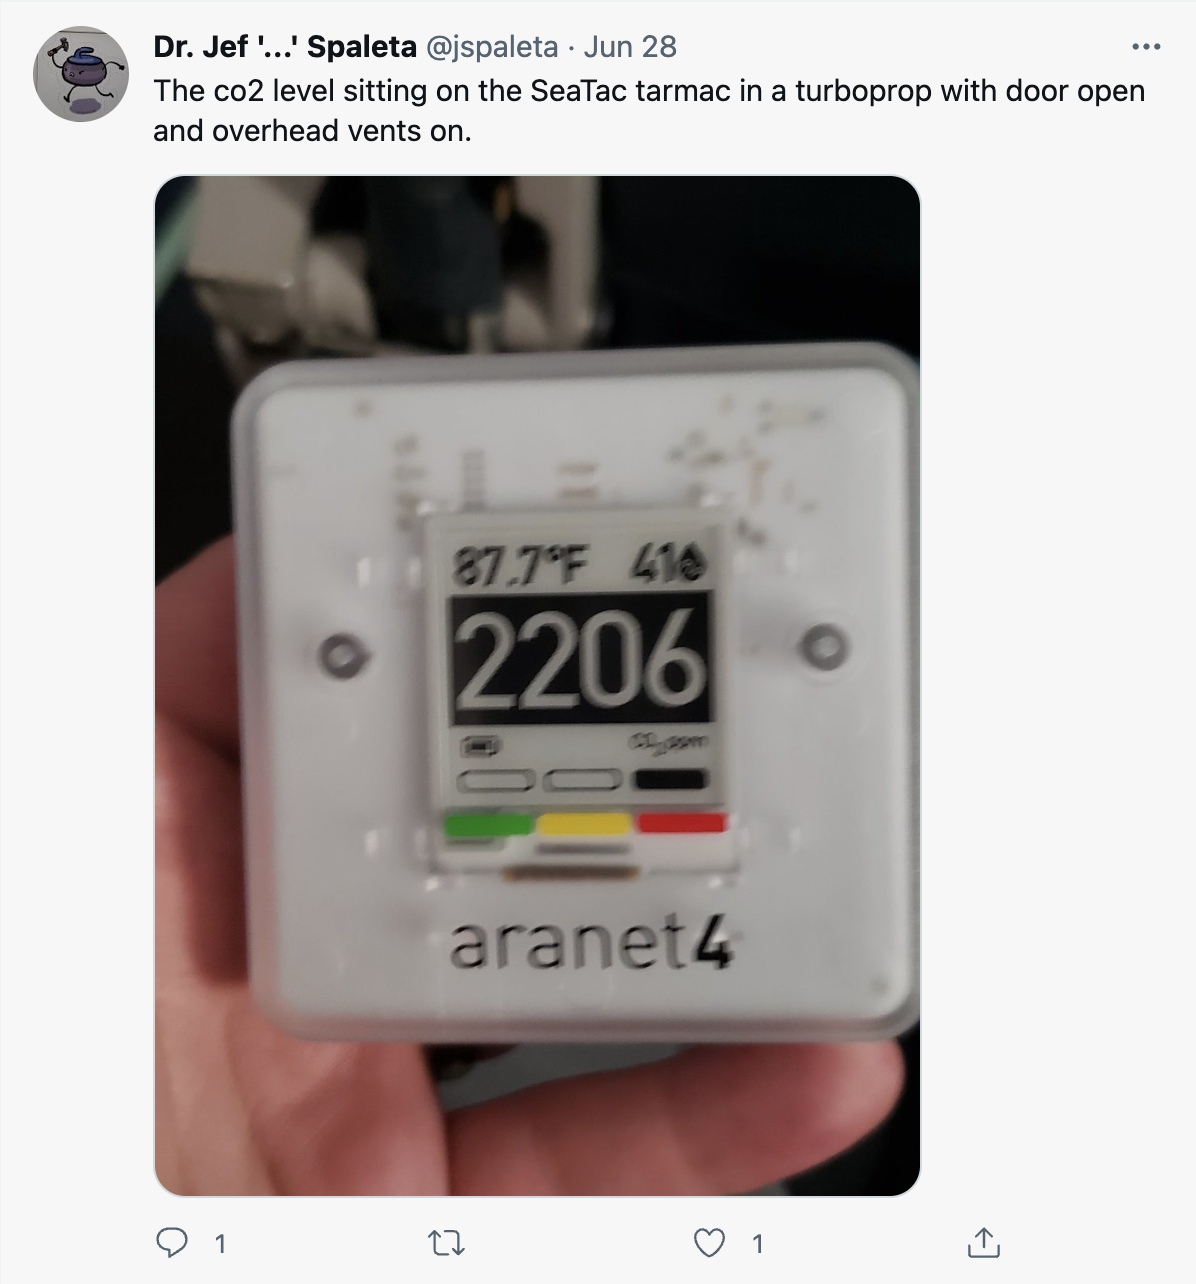
What he discovered is that the vendor hall area was far better ventilated than the main theater and apparently so was the main concourse of SEATAC airport. There’s room for improvement here, for sure. That said, it’s been two weeks since the conference and there’s not a single tweet about anyone testing positive at or immediately after the conference. This one was a win!
Observ-arama
This is a small quip, but I’m happy to report that observability has successfully all-but-replaced monitoring in common parlance. As a writer, I pay close attention to the words we use and how we use them. At the last Monitorama, in 2019, observability was considered a somewhat new term for what we do (though not a new term historically). This year, when people said “monitoring”, they said it more out of habit, and quickly corrected themselves, or said “monitoring/observability.”
Personally, I’d like to see wide-spread use of additional conjugations: “observe” not “monitor”; “observations” not “metrics, events, traces, and logs”; “observing the system” not “waiting for the inevitable disaster which will occur the moment you collapse from exhaustion due to your PTSD-induced hyper-vigilance.”
But I suppose that would mean we need to change the title of our beloved conference to… Observa-rama? Observa-fest? Observa-palooza? Doesn’t really roll off the tongue the same way, does it.
Gartner Observability Report
Probably the most significant validation of the permanent shift to using “observability” to define our practice is the inclusion of an Observability category in the 2022 Gartner® Magic Quadrant™ for Application Performance Monitoring (APM) and Observability. This was not lost on the Monitorama community, and the report came up frequently in hallway conversations and occasionally on stage. We are proud that Sumo Logic was named a Challenger in our first placement to this Magic Quadrant and we see the Challenger status as a reflection of the need for new approaches to application monitoring to keep up with the pace of innovation. Now… let’s talk themes!
2022 Themes
I do not claim to have a crystal ball, massively-scalable telepathy, or an analytics database of all observability professionals’ online search history. But from my lens as a conference attendee, I was able to discern a few themes emerging from the milieu.
SLO and SLIs
The concept of SLAs (service level agreements) is old and storied. But SLAs live in the Land of Legal Contracts™, not in the Commonwealth of Code where we practitioners reside. Engineers speak in numbers, and so SLAs are necessarily decomposed into SLOs (service level objectives) which are expressed in more clearly measurable quantities. That’s all fine and good, but now we need to get metrics about our system to know if we are meeting those objectives – enter the SLI (service level indicator).
Personally, I’m not a big fan of the MBA-driven business-ification which seeks to capture and tame the beauty of wild code, nor the acronym-ification of language that comes with it. SLIs are a natural evolution of a world modeled in OKRs, KPIs, KRAs, SLAs, and there are likely many other as-yet-undiscovered species of measurement systems lurking in the evolutionary cesspool of business frameworks, which we will someday be required to implement.
But SLIs are kind of useful, especially in our industry. They provide an interface between operational metrics and business metrics, and they might just be the answer to “what, exactly, do we alert on?” which is why, in 2022, they are a huge theme.
Tracing
Continuing with things that are not new, but are bubbling up to the surface more and more, tracing is a word that seems to be on everyone’s mind. A big reason for this is the perceived wastefulness of storing logs, and the difficulties of recreating user experiences from them and connecting those experiences to the code responsible.
Nowadays, most systems are distributed systems. The age of monolithic systems is over and every action a user takes is divided into many tiny steps, spread across large networks of single-purposed services. It is difficult to see an integrated view of a user journey, or connect a report of “the button didn’t work” back to some minor false-positive result in some distant cache. But that’s exactly when you want to reach for tracing in your bag of observability tricks.
Tracing helps us make user journey’s more tangible, but the state-of-the-art is still quite cumbersome to interact with. People are improving it and there is a large demand. Our industry keeps evolving and changing focus, from log collection and simple periodic checks, to metrics and time-series analysis; and now as we seek to more deeply align business needs (a.k.a., customer experiences) with operational needs, we are demanding that traces be the noun of the future (though I still think we should just call them observations).
Frustration with Prometheus
Another shift is a change in attitude towards Prometheus. This tool has been the darling of our industry from 2016 until now. It’s free and widely used, and the Prometheus Exposition Format (aka, Open Metrics) is a de-facto standard for exposing metrics in your service. However, it is not perfect by any means. As an industry, we are finally starting to understand its limitations and tire of them. Multiple talks spoke of problems with scaling Prometheus as an obvious and relatable fact, and at least two new products emerged as replacements/extensions for the Prometheus server. It’s been a good run, Prometheus, but the community needs you to evolve or make room for something more well-suited to the problems of today.
Aside; similar to this theme, but more quietly, I heard a certain amount of grumbling about Datadog. There’s clearly a level of appreciation for its one-size-fits-all solution, but I heard many mentions of difficulty navigating and extending it, both on and off stage. Also, while they did sponsor the conference, they were curiously absent despite most other major vendors sending a delegation. Is Datadog losing touch with the community, blinded by success now that it’s a market leader? This is an unfortunate and oft-repeated story.
The Value of Middleware
Another big theme is a stronger understanding of the value of middleware. In our industry there are things that produce observations (logs, metrics, traces, events, etc), and things that store them, and things that analyze them and things that react to the results of those analyses. But the simple “produce, then store” workflow is increasingly becoming more sophisticated. Storage is costly, and there is a growing understanding that the less we can store, the better.
In comes our hero: middleware. Tools that sit in the middle of the pipeline, which can understand and react without the need for long-term storage, which can intelligently decide when to send data to storage, and when to leave it be. Middleware systems can react faster, with a shorter loop, triggering remediation in an instant, because they live closer to the edge.
This is an area that Sensu has occupied for over a decade now, and we know it well. For a long time we were one of the only products championing this approach. My colleague and co-founder of Sensu, Caleb Hailey, reported that the observability pipeline (i.e. middleware) was an up and coming trend at the last Monitorama event before COVID: Monitorama Baltimore. It seems that this trend has exploded during the pandemic, because this year I saw several products attempting to hold the middle, hoping to become the shortstop in our observability architectures. Perhaps because Prometheus is dropping the ball? Perhaps because middleware and open standards mean more options instead of more vendor lock-in? Perhaps because the lag time between collection and processing can consume our entire quarterly budget in the event of a user-facing outage? Perhaps because tracing is easiest to do in the moment rather than after-the-fact? Is 2022 the season of middleware, for all these reasons and more? Personally, I think so.
OpenTelemetry
Another topic that was on the tip of everyone’s tongue was OpenTelemetry. Most of the speakers mentioned it at least once. In fact, the first talk of the conference was from the consummate contrarian Corey Quinn, who ranted about how OpenTelemetry “works in theory, but not in production”. ZOMG, No. He. Didn’t!?!? Oh yes, He did. This strong claim led every subsequent speaker to make a loud and specific point about how they were in fact, actually very much using OpenTelemetry in production, thank you, and led every vendor to reassure you that they were building their entire product around it as we speak.
While Corey may have been massively ratioed on the topic, he’s not wrong about the basic assertion that interoperability has been a huge issue for our industry. OpenTelemetry is what we need, and we need it to be core to everything we build. I also predict that it will continue to be a core theme for the next few years to come.
I hope you enjoyed my overview of the main Monitorama 2022 themes. Be sure to check out Part Two to learn about some of the best talks from the conference.
A version of this article also appears on the Sumo Logic website.

Made with #monitoringlove by SensuTM in Canada 🇨🇦 and the USA 🇺🇸. © 2017-2021 – Privacy Statement – Terms & Conditions