
The best performing organizations rely on metrics to monitor and understand the performance of their applications and infrastructure. As a result, telemetry data and time-series databases (TSDB) have exploded in popularity over the past several years. The Prometheus monitoring platform is one of the most popular TSDBs available today. But how effective is Prometheus, and what are its limits?
This article answers these questions and explains how Prometheus monitoring can benefit your company. We will also look at alternative monitoring tools to help you make the right choice for your organization's needs.
What Is Prometheus?
Prometheus is a monitoring solution for recording and processing any purely numeric time-series. It gathers, organizes, and stores metrics along with unique identifiers and timestamps.
Prometheus is open-source software that collects metrics from targets by "scraping" metrics HTTP endpoints. Supported "targets" include infrastructure platforms (e.g. Kubernetes), applications, and services (e.g. database management systems). Together with its companion Alertmanager service, Prometheus is a flexible metrics collection and alerting tool.
Prometheus Components and Architecture
Prometheus has various components that work together to track and report on system health, behavior, and performance. The primary method of data collection is scraping metrics from instrumented applications and services, which expose metrics in a plaintext format via HTTP endpoints.
The Prometheus architecture facilitates the discovery and scraping of targets that generate required data. The target may be a third-party application or a company's instrumented applications. Prometheus stores the scraped data, which you can analyze with the Prometheus Query Language (PromQL).

Prometheus Components and Architecture
To better understand how Prometheus works, let's take a closer look at its essential components.
Prometheus Server
The Prometheus server handles the scraping and storing of metrics. The server manages scheduling of monitoring jobs – querying data sources (called “instances”) at a predefined polling frequency. Monitoring jobs are configured via one or more “scrape config” directives, managed via a YAML configuration file which can be live-reloaded using a SIGHUP or the Management API.
Prometheus relies heavily on various service discovery (SD) mechanisms to identify targets to scrape. These service discovery integrations range from generic interfaces like a file-based service discovery that custom SD implementations can leverage by managing a JSON or YAML file containing a list of targets.
Prometheus also provides a number of platform-specific SD implementations, including: Kubernetes, AWS EC2, Azure, GCE, Docker Swarm, OpenStack, and more. These generally integrate with the corresponding APIs to query the platform for targets running applications and exporters that can be scraped by Prometheus.
Prometheus Exporters
Unlike other monitoring tools that rely on agents or embedded instrumentation (e.g. APM client libraries) to collect data and "push" metrics to the monitoring backend, Prometheus servers scrape (i.e. "pull") data from instrumented applications and Prometheus exporters.
Applications are instrumented using client libraries that enable an HTTP endpoint where internal metrics are exposed and collected by Prometheus servers.
Exporters are “libraries and servers which help in exporting existing metrics from third-party systems as Prometheus metrics”. Exporters are “useful in cases where it is not feasible to instrument a given system with Prometheus directly (for example, HAProxy or Linux system stats)”. See the Prometheus Exporters and Integrations documentation for more information.
One way to think of exporters is as "single-purpose monitoring agents" that are designed to collect metrics from a specific third-party system and make them available for Prometheus servers to collect.
There are just over a dozen "official" exporters (maintained as part of the official Prometheus GitHub Organization), and almost 200 exporters including those developed by the Prometheus community.
Example: The Prometheus Node Exporter
The Prometheus node_exporter is an exporter for physical and virtual machine metrics – hardware and kernel metrics exposed by *NIX kernels. A Windows exporter is also available for Windows hosts. The exact number of distinct metrics collected by node_exporter will vary from system to system (see “Collectors” for more information), and some optional collectors are disabled by default for performance and reliability reasons. The Prometheus node_exporter is officially distributed as a binary archive, although many Linux distribution maintainers now have packages available in the upstream repositories. Like other exporters, the node_exporter must be configured to listen on a dedicated port (9100 by default). Because exporters are effectively single-purpose monitoring agents, to collect metrics from other services on the same host requires additional exporters with their own service management/supervision and dedicated network ports. For example, if a host is running a MySQL database, the official Prometheus MySQL exporter would expose metrics on port 9104 by default, and node_exporter would expose machine metrics on port 9100. Caution is advised to avoid prolonged runtimes (as measured by the built-in scrape_duration_seconds metric) and avoid port conflicts, but some guidance is provided in the project README to tune node_exporter appropriately.
Prometheus Pushgateway
Although Prometheus is a primarily pull-based monitoring system, an additional component called the "Pushgateway" is available for pushing metrics from external applications and services. The Pushgateway is useful for collecting metrics from systems that are not compatible with the otherwise pull-based infrastructure.
For instance, short-lived batch jobs that are ephemeral in nature may start and end before Prometheus can discover and scrape metrics from them. The Prometheus Pushgateway can be used to push the metrics of such processes to prevent losing essential data before they get a chance to get scraped.
Prometheus Client Libraries
Applications only generate metrics after you add instrumentation to their code. You can do this via one of the Prometheus client libraries. Prometheus official client libraries are compatible with Java/JVM, Go, Python, and Ruby. Third-party client libraries are also available for Node.js, Haskell, C#/.Net, Common Lisp, Dart, Erlang, Rust, and more.
Choose a Prometheus client library that matches the language of your application. If the library does not match the application language, you'll have trouble defining and exposing the internal metrics via HTTP(S) endpoints on your application.
Prometheus Alertmanager
The Alertmanager handles alerts sent by client applications such as the Prometheus server. In practice, the Prometheus server generates alerts when an alert condition is met in a user-defined alerting rule. Alertmanager then manages those alerts, sending notifications via one of eight built-in notification receivers: email, PagerDuty, PushOver, Slack, OpsGenie, VictorOps, WeChat, and Webhooks. Once configured, Alertmanager instances handle deduplicating, grouping, inhibition, silencing, and routing of alerts to the correct receiver.
Because Prometheus alerting is separated into two parts (alerting rules and alert processing), configuring Alertmanager is only half of the battle. The bulk of the business logic around alerting in Prometheus is actually based on alerting rules, which are configured in Prometheus itself. Alerting rules are PromQL expressions that are evaluated at regular intervals by the Prometheus server. By default all Prometheus rules (recording rules and alerting rules) are evaluated on a 1m interval, but this is configurable (see the evaluation_interval parameter).
Prometheus Web UI & Visualizations
The Prometheus web app includes a built-in utility it describes as an “expression browser” which provides direct access to enter any expression and visualize its result either in a table or graphed over time. However, this is billed as primarily useful for ad-hoc queries and debugging – for actual graphs, Grafana or Prometheus Console templates are recommended.
Grafana has offered built-in support for querying and visualizing Prometheus data since 2012. One advantage of Grafana versus Prometheus Console Templates is that there are pre-built dashboards available for Grafana.
Grafana.com maintains a collection of shared dashboards which can be downloaded and used with standalone instances of Grafana. Use the Grafana.com "Filter" option to browse dashboards for the "Prometheus" data source only.
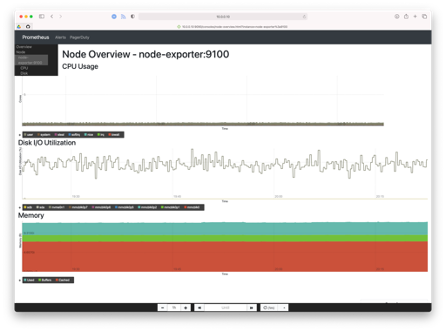
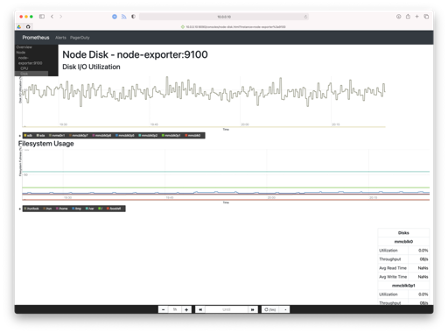
According to the Prometheus user documentation, "Console templates are the most powerful way to create templates that can be easily managed in source control", but have a "steeper learning curve" (than Grafana), "so users new to this style of monitoring should try out Grafana first." Console Templates are managed as HTML code using the Go templating language and served from the Prometheus server. There is a configurable JavaScript graphing library provided that will handle requesting data from Prometheus, and rendering it via Rickshaw. An example "index.html.example" template is provided with every Prometheus installation which is useful for developers, but the example illustrates the tradeoff of power vs complexity of the Console Templates solution versus a dedicated graphing solution like Grafana. The example template has five parts: navigation bar, menu, time controls, the main content (usually graphs), and a sidebar containing a table.
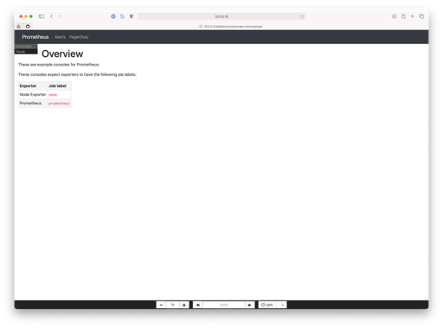
Prometheus Console Templates are managed as HTML files in /usr/share/prometheus/consoles/ by default (configurable via the --web.consoles.templates flag), and visible in the Prometheus web app at http://<hostname>:9090/consoles/<filename>. The example at /usr/share/prometheus/consoles/index.html.template is reachable at http://<hostname>:9090/consoles/index.html.example.
For more information on Prometheus Console Templates, please visit the user documentation, including template examples and template reference documentation.
Prometheus Metric Types
Prometheus monitors four primary metric types:
Counter
A counter is one of the simplest metric types. It is useful for monitoring and assessing values that can only increase. Once the value reaches a given number, you can reset it to zero and measure again.
Gauge
Gauge metrics measure values that rise and fall. This includes current memory usage or the number of concurrent requests. The metric typically appears as a single numerical value.
Summary
The summary shows the total count of observations and the sum of observed values after sampling observations. It also calculates adjustable quantiles over a sliding time window.
Histogram
Histograms are for sampling request durations, response sizes, and similar observations. It usually counts in buckets and provides the sum of all observed values. You can configure the metric calculation to suit your needs. Note, the big difference between summaries and histograms comes down to when and where the statistical quantiles are calculated. Summaries calculate quantiles client side, whereas histogram quantiles can be calculated server side using a promql expression. There are trade-offs to both approaches, so pick the statistical metric type that makes sense for your application.
Kubernetes Monitoring with Prometheus
Although Prometheus was originally developed at SoundCloud, the monitoring project as we know it today is practically synonymous with Kubernetes and the organization that governs both projects: the Cloud Native Computing Foundation (CNCF). As the second project to be adopted by the CNCF, and the second CNCF project to be promoted from "incubating" to the distinguished "graduated" status – second only to Kubernetes, which itself prompted the very formation of the CNCF – it's no surprise that Kubernetes monitoring has become one of the most popular use cases for Prometheus.
To learn more about Kubernetes and Prometheus, check out the four part blog series on monitoring Kubernetes:
- Monitoring Kubernetes, part 1: the challenges + data sources
- Monitoring Kubernetes + Docker, part 2: Prometheus
- Monitoring Kubernetes + Docker, part 3: Sensu + Prometheus
- Monitoring Kubernetes, part 4: the Sensu native approach
Prometheus Monitoring Alternatives
Prometheus is a compelling monitoring solution, but like anything else it has its limits. Below are other top monitoring tools and how they compare to Prometheus:
Other Time-Series Databases (TSDBs)
For pure-telemetry use cases, there are several popular open-source TSDBs like InfluxDB, TimescaleDB, Graphite, and OpenTSDB that make compelling alternatives to Prometheus. They all provide slightly different approaches to data storage, query capabilities and languages, and overall deployment architecture. Some offer better solutions for long-term storage, high availability, built-in visualization capabilities, or improved compatibility with existing tools and skills (e.g. SQL-like query languages, or actual SQL database backends).
Sensu
Compared to Prometheus, Sensu's event-processing platform is more versatile and powerful. It monitors metrics as well as service checks and has a robust alerting and problem detection engine. It has a OSS as well as commercial offering, and provides turn-key integrations with other enterprise IT operations solutions such as ServiceNow, Splunk, Elastic and time-series databases.
For very large environments, Sensu has features to prevent alert-fatigue and auto-remediation for known repetitive operational tasks.
You can also combine Sensu and Prometheus to enrich the telemetry data gathered by Prometheus. Sensu's service health checking abilities will fill the gaps left by Prometheus' purely telemetry-focused approach.
Is Prometheus the Right Choice?
The best way to stay on top of your organization's needs is to pair Sensu with Prometheus as complementary monitoring tools. You might need to look at other solutions to address issues such as:
- security
- remote operation behind firewalls
- integration with other monitoring solutions
- monitoring as code for large environments
Prometheus is a reliable tool for collecting and processing metrics from machines and applications. On the other hand, Sensu manages and processes more than just metric data. It is also more versatile and offers advanced features, such as automated incident response.
For deeper insight between Prometheus vs. Sensu, download our free comparison guide.

FAQ
What Metrics Does Prometheus Collect?
Prometheus gathers metrics from different systems by scraping data from HTTP endpoints. It uses this information to identify issues, such as when an endpoint is missing or should not exist or when a time-series pattern indicates a problem. Metrics collected by Prometheus include:
- Summary
- Gauge
- Counter
- Histogram
How to Check Prometheus Logs?
Prometheus mostly performs white box monitoring. Applications implement metrics endpoints for Prometheus to scrape or by running a separate exporter application. To view the logs from applications, use Prometheus exporters like Prometheus grok_exporter to parse log files and extract metrics from unstructured log data. The extracted metrics will be visible on the Prometheus monitoring toolkit.
What Are the Types of Monitoring Available in Prometheus?
The types of monitoring performed by Prometheus are instrumentation and agents/exporter. Instrumentation captures metrics by inserting custom code into the monitored application's source code. Agents run side-by-side with applications in a shared environment to automatically translate application data or logs into Prometheus metrics.
What Can You Monitor with Prometheus?
Prometheus monitors application metrics like throughput (TPS) and response times. You can also use the Node exporter to monitor host hardware and kernel metrics.
Where Is Prometheus Data Stored?
Prometheus has a local on-disk time-series database. It also integrates with remote storage systems. The local Prometheus database stores information in a customized and highly efficient format, with a default retention time of 15 days. Local storage is not clustered or replicated. If you want long-term durable storage, you have to stream collected data to remote storage solutions using one of the supported storage integrations.
How to Use Prometheus Metrics?
The metrics collected by Prometheus provide insights into the performance of your system by highlighting security incidents, underperformance, and other issues. You can use these insights to improve your organization's efficiency and more.

Made with #monitoringlove by SensuTM in Canada 🇨🇦 and the USA 🇺🇸. © 2017-2021 – Privacy Statement – Terms & Conditions