Your registration has been confirmed. Thank you for signing up!
Most popular approaches to monitoring are flawed. In this whitepaper, CEO Caleb Hailey will illustrate how to seamlessly implement and scale your monitoring and automate your monitoring workflows.
Improved operational visibility through monitoring is often cited as a top priority among CIOs and senior operations leadership, but complexity of availability and performance monitoring in increasingly ephemeral hybrid cloud infrastructures is a challenge that few have been able to overcome. This whitepaper will identify the underlying problems with most popular approaches to monitoring, and outline a solution that is both accessible and broadly scalable.
Sensu enables enterprise organizations to overcome complexity of availability and performance monitoring in increasingly ephemeral hybrid cloud infrastructures. This whitepaper will identify the underlying problems with most popular approaches to monitoring, and outline a solution that is both accessible and broadly scalable.
Improved operational visibility through monitoring is often cited as a top priority among CIOs and senior operations leadership, yet too often monitoring is implemented as an afterthought in reaction to changes in the mission critical systems that power our businesses. As production systems move to new “next generation” operating environments, they often prompt the subsequent introduction of redundant operational solutions as a stop-gap, resulting in replication and fragmentation of operational capabilities (e.g. “too many monitoring tools”). Why do we repeat this cycle, and how do we escape it?
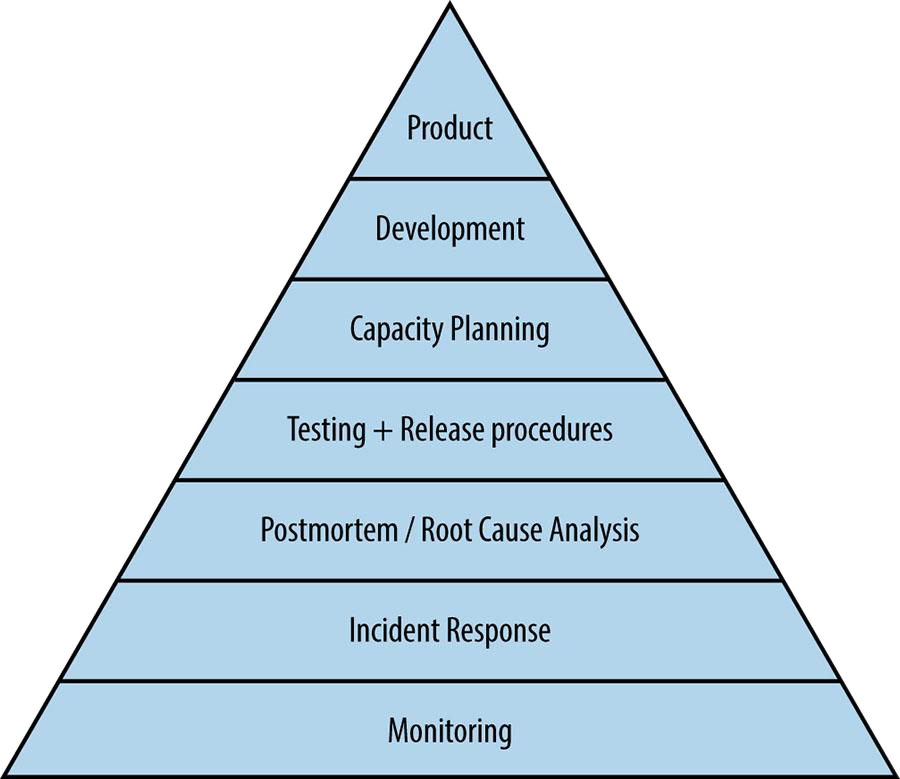 Figure 1. “Service Reliability Hierarchy” [1], from the “Site
Reliability Engineering” book by Chris Jones, Jennifer Petoff, and Niall Richard
Murphy.
Figure 1. “Service Reliability Hierarchy” [1], from the “Site
Reliability Engineering” book by Chris Jones, Jennifer Petoff, and Niall Richard
Murphy.
It could be argued that the task of instrumenting and visualizing our systems has not increased in complexity in the past 20 years. Most modern monitoring solutions are employing identical techniques[2] and/or using the exact same underlying tools[3] to verify service health and taking performance measurements. The instrumentation side of availability and performance monitoring is largely a solved problem. Similarly, the interfaces for visualizing monitoring data haven’t evolved as much as they have become more portable. We’re still looking at the same basic graphs for visualizing system performance as we were in the 90’s – it’s just that we are now able to do so from the convenience of a computer in our pocket, instead of a wall of monitors in a NOC.
The ultimate challenge in monitoring today comes from collecting and correlating availability and performance data from ephemeral systems. In the last 10-15 years, infrastructure delivery has evolved rapidly from bare metal and traditional virtualization platforms (e.g. VMware), to public and private cloud providers and platforms (IaaS), Platform as a Service solutions (PaaS), and now container orchestration & function-based computing (or “serverless”). These computing platforms have empowered a new generation of system architectures – prominently including “microservices” – that have shifted operational complexity from the application level to the various layers of abstractions that these applications and services rely on. Monitoring solutions can no longer expect a service or (virtual) device to be present from one moment to the next, as automated provisioning events (e.g. “auto scaling” and “rolling updates”) drive nearly constant change.
Further complicating this underlying challenge is the fact that the rate of ephemera is accelerating. Digital Transformations, Cloud Migrations, DevOps, Containerization, and other initiatives bearing such promising titles as “Enablement” are compelling movements in the modern enterprise. Although they vary in scope and overlap or intersect in practice, they are unified in purpose: to deliver increased organizational velocity. In other words, they empower our organizations to ship change, faster. The practical reality of these initiatives is that no change is a complete transformation. Workflow migrations are started without a clear path to 100% completion, leaving behind “legacy” systems that continue to fulfill some percentage of mission critical production workloads. More often than not, subsequent generations of change are initiated before the current/previous evolutions have been completed. It is a vicious cycle that exacerbates the challenge of obtaining operational visibility, and delaying adoption of the solution to these challenges only increases risk exposure and cost.
Sensu™ is the industry’s first Monitoring Event Pipeline (MEP) – a battle-tested solution that brings workflow automation to monitoring. Sensu’s pipeline approach to monitoring solves the underlying challenges associated with hybrid cloud infrastructures and ephemeral systems by converting industry standard monitoring data into events, and comprehensive set of configurable monitoring primitives for processing that data at scale.
Sensu™ consumes monitoring events (e.g. availability and performance data) and provides configurable primitives like event filters[4], event payload mutators[5], event handlers[6], and more[7], for modeling monitoring workflow automations.
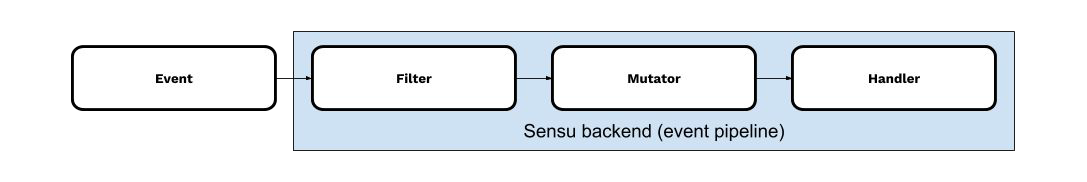 Figure 2. the Sensu™ MEP backend.
Sensu’s unique MEP approach enables organizations to consolidate and integrate disparate and otherwise incompatible monitoring tools – connecting outputs of instrumentation utilities spanning modern and legacy infrastructure with existing operational systems (e.g. ITSM systems). The possibilities can be visualized very simply:
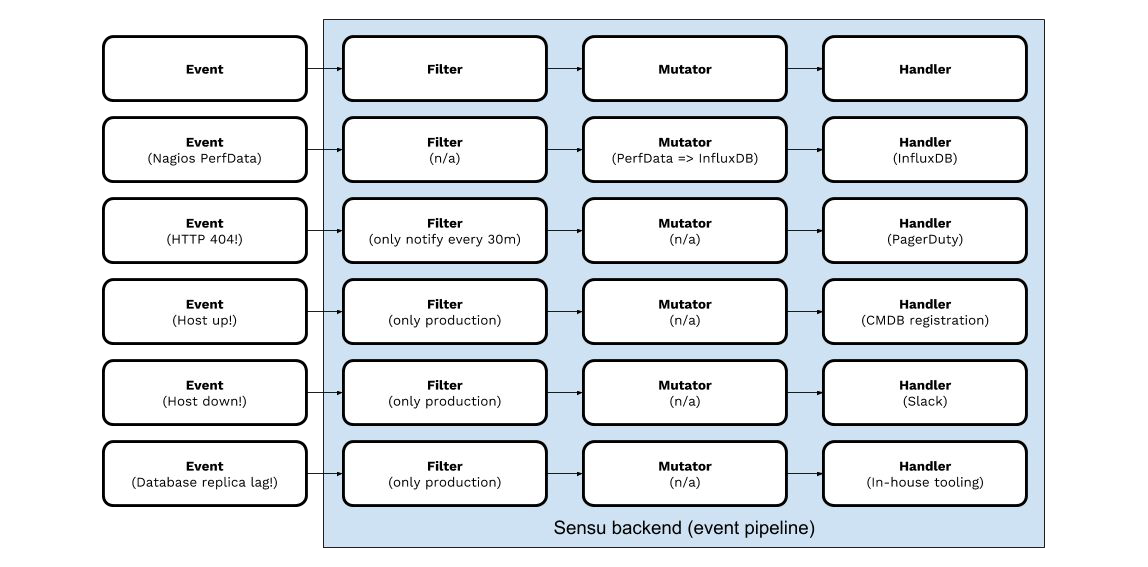 Figure 3. MEP examples.
Monitoring events are another key primitive in the MEP approach; they provide a simple and extensible abstraction for discovery events[8], device and service health[9], telemetry data[10], and alerts[11].
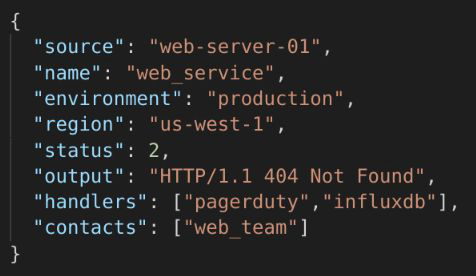 Figure 4. A pseudo representation of a monitoring event.
By pairing a developer-friendly event specification[12] with a number of standards-based interfaces for consuming events[13], Sensu can consume monitoring events from a variety of producers, including events produced directly from applications and services (e.g. APM data).
Sensu’s MEP backend was designed to work in concert with the Sensu agent, which provides automated discovery, an execution platform for monitoring data collection, a scheduler[14], and a solution for converting outputs of popular monitoring utilities (e.g. Nagios plugins, StatsD libraries, Prometheus exporters) into events for processing in the pipeline.
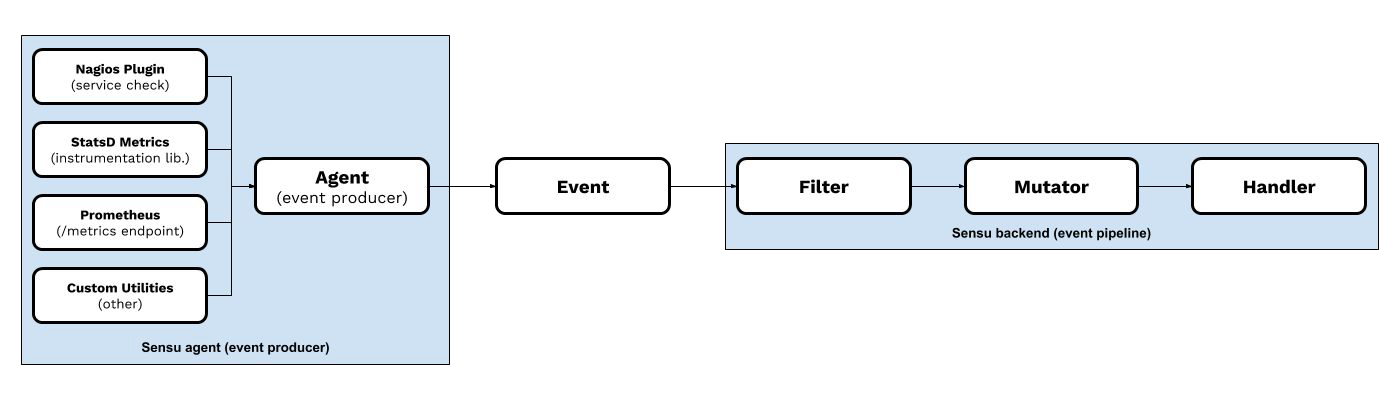 Figure 5. the Sensu agent – an event producer.
The Sensu agent complements the Sensu MEP backend by reducing operational complexity. Applications and services running on hosts with local access to a Sensu agent can be monitored without requiring awareness about their operating environment, or the monitoring system itself. Sensu agents allow monitoring events to be collected locally and/or published to local endpoints[15] and then routed to the pipeline over Sensu’s event bus[16].
No matter how promising, no solution holds value for the modern enterprise if it cannot be operationalized at scale. The best monitoring strategy in the world would easily be rendered worthless if the requirements for entry are too cumbersome for broad adoption. In fact, this is exactly why we see so many disparate monitoring systems deployed inside of most enterprise organizations – teams often choose to adopt new tools rather than conform their workflows to the offerings provided and supported by internal services teams. For any monitoring solution to be truly effective it must offer a cohesive strategy and roadmap that customers can rally people around, and deliver against. Sensu’s MEP solution embodies these qualities by abstracting away the complexity of availability and performance monitoring in increasingly ephemeral hybrid cloud infrastructures, creating the following platform benefits:
Simple interfaces.
Sensu supports traditional service checks (Nagios, Zabbix), instrumentation libraries (StatsD, Prometheus exporters), legacy protocols (SNMP), and monitoring events emitted from custom applications (APM) or shell scripts.
Powerful monitoring primitives.
Automated discovery, scheduler, metric collection & conversion, event/alert filtering, pluggable handler framework, and more. All compatible w/ infrastructure as code best practices for reliable and repeatable deployments, and complete auditability.
Limitless possibilities.
Validate & correlate events, send alerts, manage incidents, update CMDBs, trigger automated remediations, route telemetry data to TSDBs, and so much more!
Sensu is battle tested at scale, and trusted for production workloads by industry leaders. From fast moving startups to mid-sized enterprises and Fortune 500 organizations, Sensu customers are finding success in automating their monitoring workflows using Sensu. Whether driven by cloud migration, hybrid cloud adoption, or consolidation of monitoring tools – Sensu’s powerful MEP platform not only provides solutions for the problems our customers face today, but also the right foundation to tackle the challenges of tomorrow.
In one recent deployment, a customer was able to completely replace and disable their legacy monitoring solution – relied on for monitoring over 10,000 systems – less than 9 months after beginning their Sensu migration.
Here are just a few quotes from Sensu users on what they love about Sensu:
“We chose Sensu in our quest to adopt more of a cloud first application deployment model. We needed a more modern, flexible monitoring solution for distributed systems.”
— Jeff Barrows, General Electric
“Merging the technology stacks of two mature companies was a tremendous challenge that was made considerably easier due to the robust, flexible monitoring solution that Sensu provides.”
— Dermot Hennessy, Head of IT Operations, Paddy Power Betfair
“Apps can emit check results to Sensu’s API without the need for an agent – yet still get all of this auto registration hotness.”
— Chris Chandler, T-Mobile
Additional testimonials and customer references available upon request.
Sensu’s mission is to obviate the need to build custom monitoring solutions. Founded in 2017, the firm aims to empower companies to deliver value to their customers faster, at a larger scale, and with full confidence that comes from deep visibility into the health and performance of their systems and business. The company maintains the free and open source Sensu monitoring framework as well as the commercially-supported Sensu Enterprise platform, which enhances the open source framework with features to simplify operations, governance, and multi-datacenter support for fast-paced companies to run monitoring at scale.
Sensu currently operates as a fully distributed team, with over 35 employees in the United States and Canada, and recently opened its first office in Portland, Oregon. The company is backed by world class investment firms Foundry Group and Battery Ventures, having raised $12.5M in venture capital to facilitate it’s rapid growth. Sensu’s Board of Directors includes co-founders Caleb Hailey (CEO) and Sean Porter (CTO), investors Ryan McIntyre (Co-Founder and Managing Director, Foundry Group) and Dharmesh Thakker (General Partner, Battery Ventures), and Luke Kanies (Founder, Puppet).
For more information, visit our website at https://sensu.io, or follow Sensu on Twitter, @sensu.
most modern monitoring techniques involve one or more of: executing service checks (including custom scripts), or instrumenting applications with various libraries that emit application performance and event data. ↩︎
for example, see StatsD support in tools like DataDog (see DogStatsD), SignalFX, and many others (including Sensu). Many of these tools will market support for “custom application metrics”, when in reality they are just consuming StatsD metrics. ↩︎
see https://docs.sensu.io/sensu-core/latest/reference/filters/ ↩︎
see https://docs.sensu.io/sensu-core/latest/reference/mutators/ ↩︎
see https://docs.sensu.io/sensu-core/latest/reference/handlers/ ↩︎
Sensu provides many other primitives for things like monitoring checks, aggregates, silencing events, and more. Most core primitives also offer corresponding RESTful HTTP APIs as well. ↩︎
discovery events (e.g. “service discovery”) are events that inform the monitoring system of the existence of a device or system, a new instance of a service or application, etc. Sensu has built-in support for automated discovery, including the ability to trigger workflows when a device, system, service, or application is discovered – and when it decommissioned. ↩︎
device and service health events (often referred to as service checks) are generally used for availability monitoring. ↩︎
telemetry events containing telemetry (measurement) data are generally used for performance monitoring. Sensu is a powerful telemetry collection platform, and is often paired with a Time Series Database (TSDB) such as InfluxDB for long-term storage and analysis. ↩︎
monitoring events may be as simple as basic alerts (e.g. sending a notification). ↩︎
see https://docs.sensu.io/sensu-core/latest/reference/events/ ↩︎
see the Sensu agent reference documentation, under “Client Socket Input”. ↩︎
Sensu backends provide advanced scheduling capabilities, publishing requests that are consumed by Sensu agents. ↩︎
see endnote #13 regarding client socket input (at TCP/UDP socket exposed by the Sensu agent). ↩︎
see https://docs.sensu.io/sensu-core/latest/reference/transport/ ↩︎

Made with #monitoringlove by SensuTM in Canada 🇨🇦 and the USA 🇺🇸. © 2017-2021 – Privacy Statement – Terms & Conditions