Your registration has been confirmed. Thank you for signing up!
In this whitepaper, Sensu CEO Caleb Hailey walks through the various APIs that are necessary for complete visibility into your Kubernetes platform. You’ll come away with a deeper understanding of how Kubernetes works, with a behind-the-scenes look at cloud-native observability.
An important early step (just after “Orchestration & Application Definition” in the CNCF trail map) in starting your cloud-native journey is picking solutions for observability, including monitoring, logging, and tracing. All of these observability tools leverage data available from Kubernetes’ comprehensive APIs. Those APIs provide insights into the events that are occurring inside of the Kubernetes platform, including answers to questions like: “What’s running in my Kubernetes cluster?”
CNCF Ambassador Chris Short and I recently co-hosted a webinar with the Cloud Native Computing Foundation on the seven most useful Kubernetes APIs for comprehensive cloud-native observability. In this whitepaper, I’ll recap that webinar, walking through the various APIs that are necessary for complete visibility into your Kubernetes platform. You’ll come away with a deeper understanding of how Kubernetes works, with a behind-the-scenes look at cloud-native observability.
Before I dive into the APIs, I want to talk about observability and its role in the cloud-native journey. At Sensu, we’re biased, of course — we think constantly about observability and monitoring. And we’re not alone. Last year I had the opportunity to sit down for dinner with Gene Kim, and I asked him why he thinks monitoring and observability are important. I loved his succinct answer:
“You can’t perform any operation without proper visibility.”
That immediately made me think of so many kinds of operations that require visibility in order to be successful — for example, driving a car (impossible if your windshield is covered in ice) or performing surgery (surgeons rely on a plethora of monitors and video scopes, depending on the type of operation). For anything you do, you have various instruments that give you information about the operation you’re performing, so you can do it correctly, and course-correct as needed.
It’s exactly the same for systems. I’ve always liked the service reliability hierarchy diagram from Part 3 of the Google SRE book. You can see it places monitoring at the foot of the pyramid as the foundation for operating systems reliably.
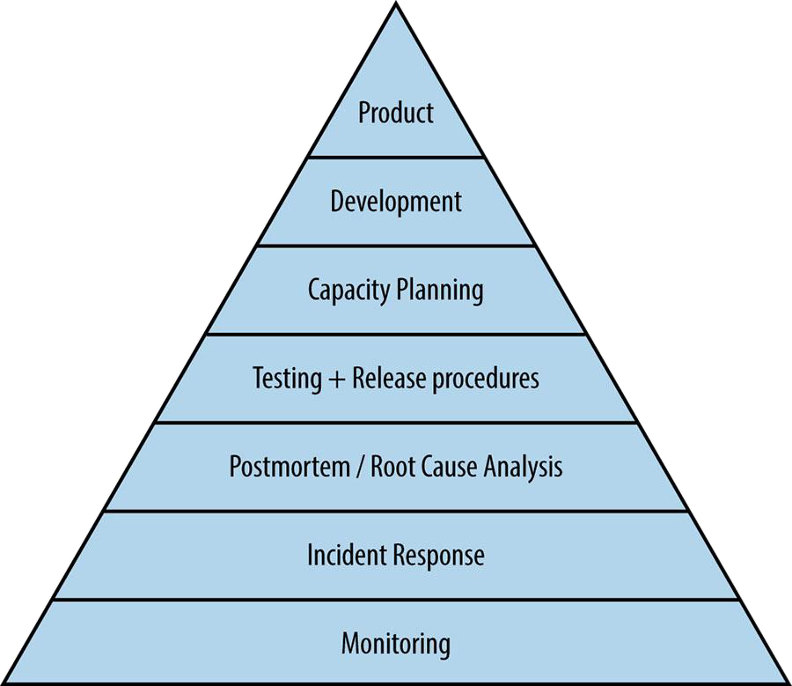
“Service Reliability Hierarchy,” from the Site Reliability Engineering book by Chris Jones, Jennifer Petoff, and Niall Richard Murphy.
I also like the CNCF trail map for enterprises embarking on their cloud native journey — it’s logical and easy to understand.
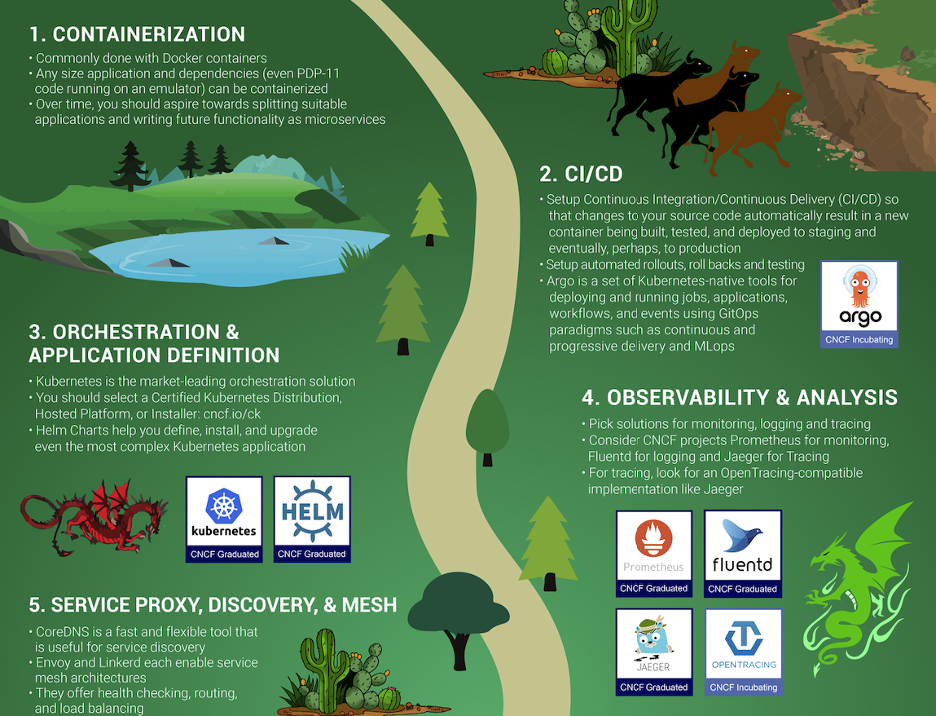
The first few steps of the cloud-native journey, according to the CNCF trail map.
As you can see, the first step in the journey is containers. As the heart of all things cloud native, you need to understand what they are and how they work. Conceptually, a container is a tarball and some metadata; it isn’t really a technology of its own, but a collection of technologies that have been around for a long time – thanks to excellent work by Docker and others to productize the underlying technologies, containers have exploded in popularity over the past few years.
Once you understand how containers work, you need to start building container images as part of your CI/CD pipeline, with every new release of your software. Then you’ll need a container orchestration platform, and of course, the CNCF promotes Kubernetes as the natural choice (and we agree). Containers, CI/CD, and container orchestration are the foundation of your cloud native journey – but what comes next?
On the trail map, Observability & Analysis is Step No. 4, after Orchestration & Application Definition. There’s some text on the trail map that states, “everything after step #3 is optional based on your circumstance.” I don’t think this means that the CNCF believes observability is optional in production. I interpret it to mean that if you’re in a pre-production environment, in certain cases you might not need to be so concerned about everything after Step No. 3. But when you start building and operating mission-critical systems on Kubernetes — which is what we all aim to do — observability is absolutely not optional. It’s critical. Remember: “You can’t perform any operation without proper visibility.” Observability helps us improve our products and services, and it alerts us if/when things break.
Without further ado, let’s get to the top seven Kubernetes APIs for cloud-native observability.
I’m listing the top 7 APIs in reverse order, from No. 7 to No. 1, because it seems like a logical way to talk about how these APIs work and how some can be used together. They are:
These Kubernetes APIs will help you achieve a holistic view of your Kubernetes cluster’s health, delivering richer observations and the additional context you need to complement your normal metrics.
Please note that the order/rank of APIs in this list is very subjective – I’ve ranked some lower because they’re more well known and broadly supported across most monitoring and observability tools (e.g. metrics APIs and the Pod API), and others are ranked higher to raise awareness (e.g. Events API and API Watchers). In practice you’ll want to leverage all of these APIs to support an effective observability strategy, and the priority will vary depending on your needs, so continue reading to learn more.
As I get into the details of each of the APIs, I think you’ll understand why they are all so valuable.
The very core of monitoring is metrics, so you may be wondering, “Why has he put metrics APIs as No. 7 on this list of top Kubernetes APIs?” As mentioned earlier, the order of this list is subjective, and frankly, the metrics APIs are the best known and most-talked-about set of APIs for Kubernetes, I feel like they don’t need as much attention or explanation. There’s no question that metrics are critical, which is why it’s now table stakes for any modern monitoring & observability solution to collect Kubernetes metrics.
All the Kubernetes metrics are exposed as Prometheus endpoints, so anything that can consume Prometheus metrics can collect these metrics.
kubectl describe service In a nutshell, Kubernetes service APIs are vital if you need to monitor anything more than a single pod — for example, a running application. It’s often argued that Kubernetes is best suited for microservice architectures, so if you’re using Kubernetes, you are likely going to be running disparate applications or services. And these need to be able to communicate with one another (via Kubernetes Services).
Without proper visibility into your Kubernetes Services, you could have a situation where your applications are functional and your observability data from pods themselves is not reporting any errors. But if your applications aren’t equipped to detect and/or report on network failures, and you aren’t monitoring the Services, you’re going to have some blind spots.
You may already be familiar with exploring the state of a Service via kubectl describe service commands. But in fact, you can get all that status information from the service APIs. I’ve ranked the Service API as No. 6 on the list because it’s a well known component of Kubernetes, but if you’re overly familiar with kubectl service commands due to frequent troubleshooting, that might be a clue that you need to improve your monitoring and observability around Kubernetes Services via the Services API.
In my opinion, the container API is really a kind of quasi-API. While it’s listed in the Kubernetes API reference docs, containers are not actually a first-class resource in Kubernetes. You won’t find a container endpoint anywhere in the Kubernetes API.
Because containers are actually a component or resource of a Pod, you can get information about running containers via the Pod API, including configured resource limits and resource requests (for example, CPU and memory). Earlier we mentioned that the various Kubernetes metrics APIs also include things like cAdvisor metrics (i.e., per-container resource consumption), so if your current observability solution lacks the ability to drill-down into container-level metrics and overall container health, you may need to investigate whether you’re collecting container data from the Pod API and all of the available metrics APIs (e.g., kubelet metrics).
kubectl describe pod <pod name>The Kubernetes API reference docs include the Pod API under Workload APIs. It can give you information such as the source of an image; the command you started with; which networking configuration has been applied to an individual container; execution environment variables; resource requirements; and more.
Regardless if you’re a Kubernetes expert or just getting started with Kubernetes, you have almost certainly run the command kubernetes describe pod <pod name>. This is one of the more well-known commands in the Kubernetes CLI tool. Like all the other primary, first-class resources in Kubernetes, this API gives you metadata, spec, and status information.
One interesting fact about Pods is that they are the core building block of all Kubernetes workloads, but it is unlikely that you will ever manage or configure them directly. Pods are typically created and managed via controllers. The most common workflows create Kubernetes StatefulSets, DaemonSets, Deployments, or Jobs; these controllers then create and manage one or more ReplicaSets, and ReplicaSets create and manage the actual pods.
The “Miscellaneous” API Function
As you go through the Kubernetes API reference docs, you’ll notice that every API endpoint supports your normal CRUD operations — create, read, update, and delete. Some of the API endpoints have what’s called “miscellaneous” functions, and the pod API has a very interesting miscellaneous function: to read the logs of any pod’s containers. If you’ve used the kubectl log command, you can get the very same output programmatically from the Kubernetes APIs. Here’s a simple demo:
You can see I use kubectl to go and fetch logs from a container. I can request the logs for this particular pod, and for a specific container member of the pod. I can specify parameters to determine how much history I want to see, such as how many log lines to display, or how many seconds’ worth of logs.
If you are missing any of this context, and find yourself often running these kubectl log commands, know that you can get it all via the Pod API. Leveraging these APIs to fill gaps in your observability is a chance to learn something new.
The Kubernetes downward API enables pods to expose information about themselves to containers running in the pod via files or environment variables. I find this one interesting because it’s using a different set of interfaces than we typically think of in the context of a modern API: files and environment variables (instead RESTful HTTP JSON APIs). Using files and environment variables provides access to a lot of rich context that can be exposed in backwards-compatible ways for legacy applications. You may have legacy applications that expect to consume certain information from files on disk, or from some known environment variable. With Kubernetes, you have all the tools you need to expose that very same information, dynamically, into running containers.
The Kubernetes reference documentation emphasizes the importance of gathering information about containers without coupling too tightly with Kubernetes:
Motivation for the Downward API
It is sometimes useful for a Container to have information about itself, without being overly coupled to Kubernetes. The Downward API allows containers to consume information about themselves or the cluster without using the Kubernetes client or API server.An example is an existing application that assumes a particular well-known environment variable holds a unique identifier. One possibility is to wrap the application, but that is tedious and error prone, and it violates the goal of loose coupling. A better option would be to use the Pod’s name as an identifier, and inject the Pod’s name into the well-known environment variable.
The downward API is actually a pod configuration directive. In your controller manifest — whether that’s a Deployment or StatefulSet or DaemonSet — you configure volume mounts or environment variables that read their contents or values from the downward API.
Some observability tools try to read directly from the Kubernetes APIs. That may not be an option for you in your environment, or if you’re operating a legacy system where you are trying to implement your monitoring or observability in Kubernetes using tools that weren’t natively designed to run there. This is an alternative way to expose richer information to those applications and your monitoring and observability tools.
The downward API is one of the more interesting Kubernetes APIs because of the importance of high-cardinality in observability — structured events with highly variable values make for rich observations. The Downward API makes it easy to access a lot of rich context no matter what observability tools you’re using.
There are two different selectors that can be used in the downward API: the fieldRef selector and the resourceFieldRef selector. The fieldref selector exposes most of the fields from the actual pod resource itself into a container. The resourceFieldRef selector exposes information about an individual container into the container itself. That could be context such as the CPU and memory requests, and/or limits for the container; you can expose these directly into the container using the downward API.
The available fields in the fieldRef are the same three things that we have for managing our resources: metadata, spec, and status. “Metadata” is labels and annotations. “Spec” is things like the service account, or which underlying kubelet node this particular container is running on. That’s useful in case you need to correlate issues impacting multiple containers – are they all running on the same node? You likely already have monitoring or observability for the infrastructure that Kubernetes is running on, and if there are underlying faults, the information you get from the spec fieldRef enriches any observations or metrics you’re collecting from a container running inside a pod on a kubelet. Various kinds of status information also can be exposed.
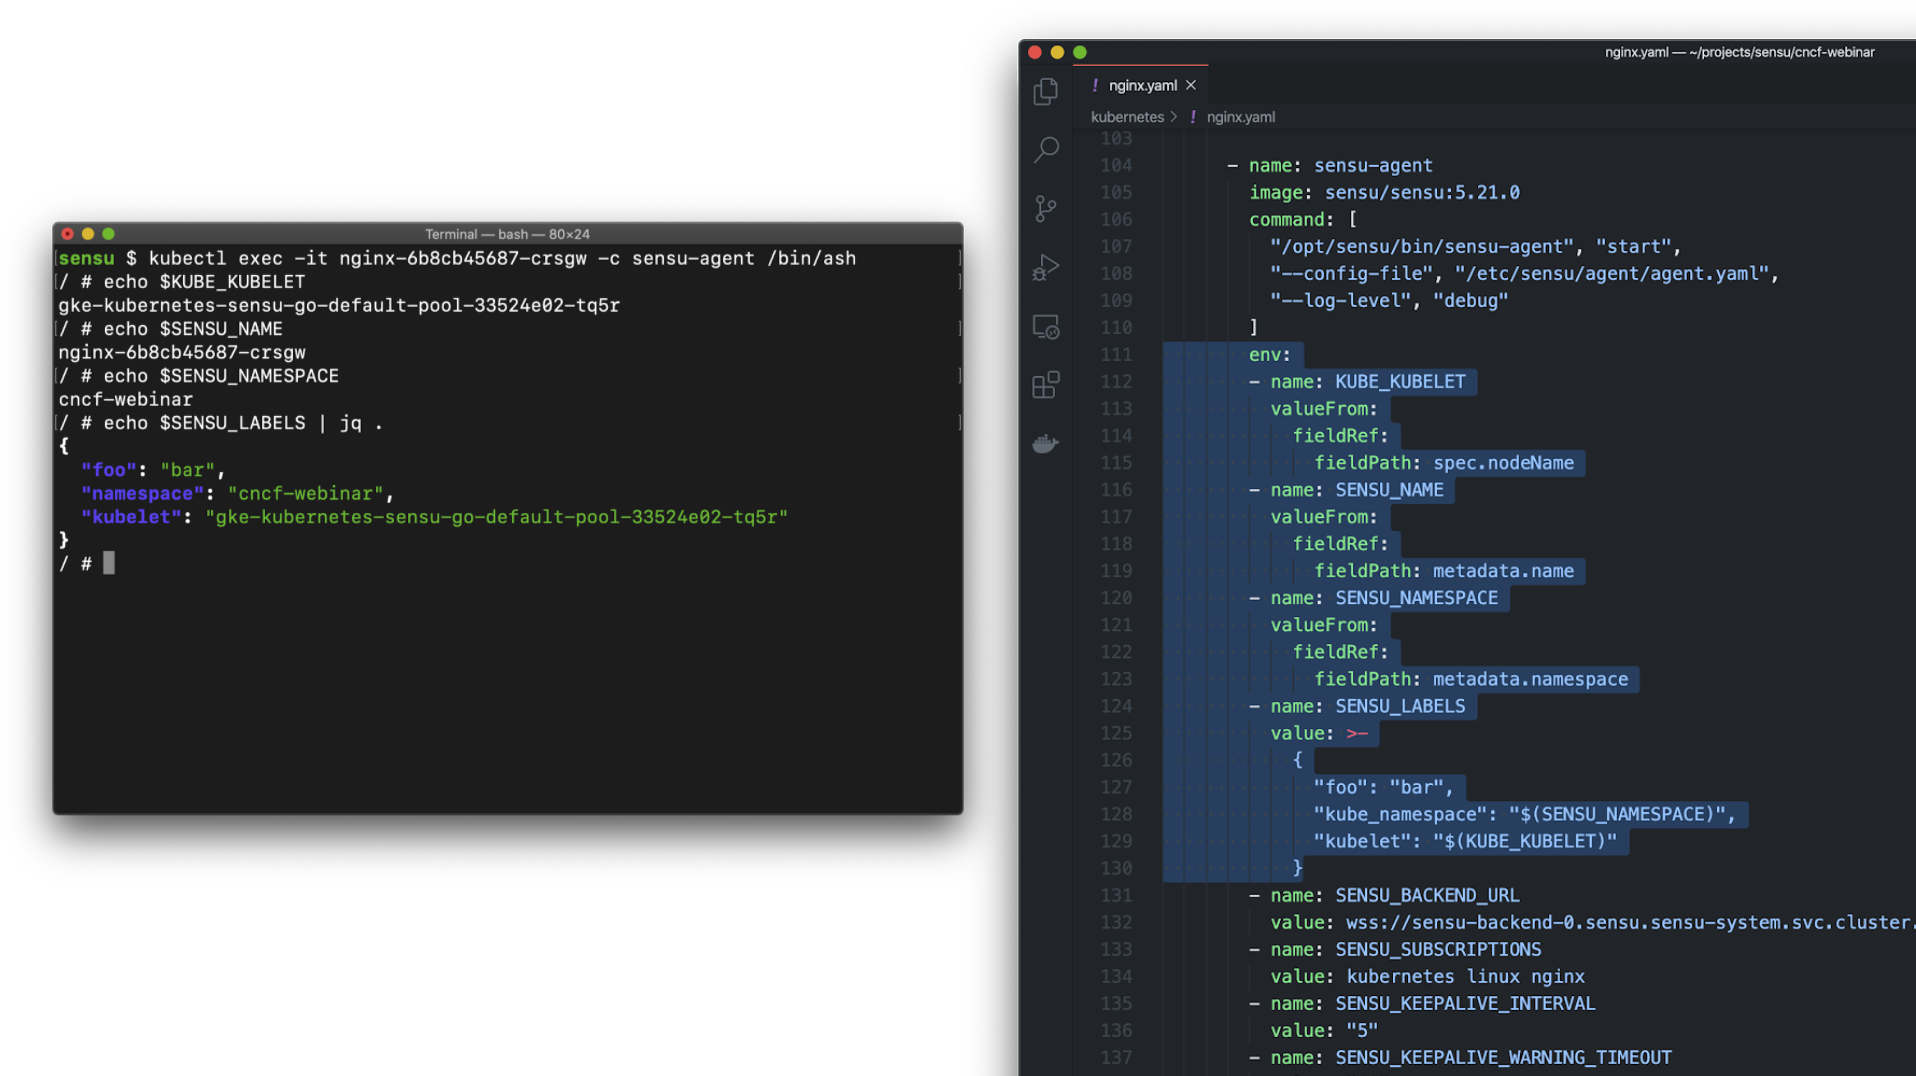
Here’s a simple example of what it looks like to use the downward API to expose the rich context — that is, the metadata — via files.
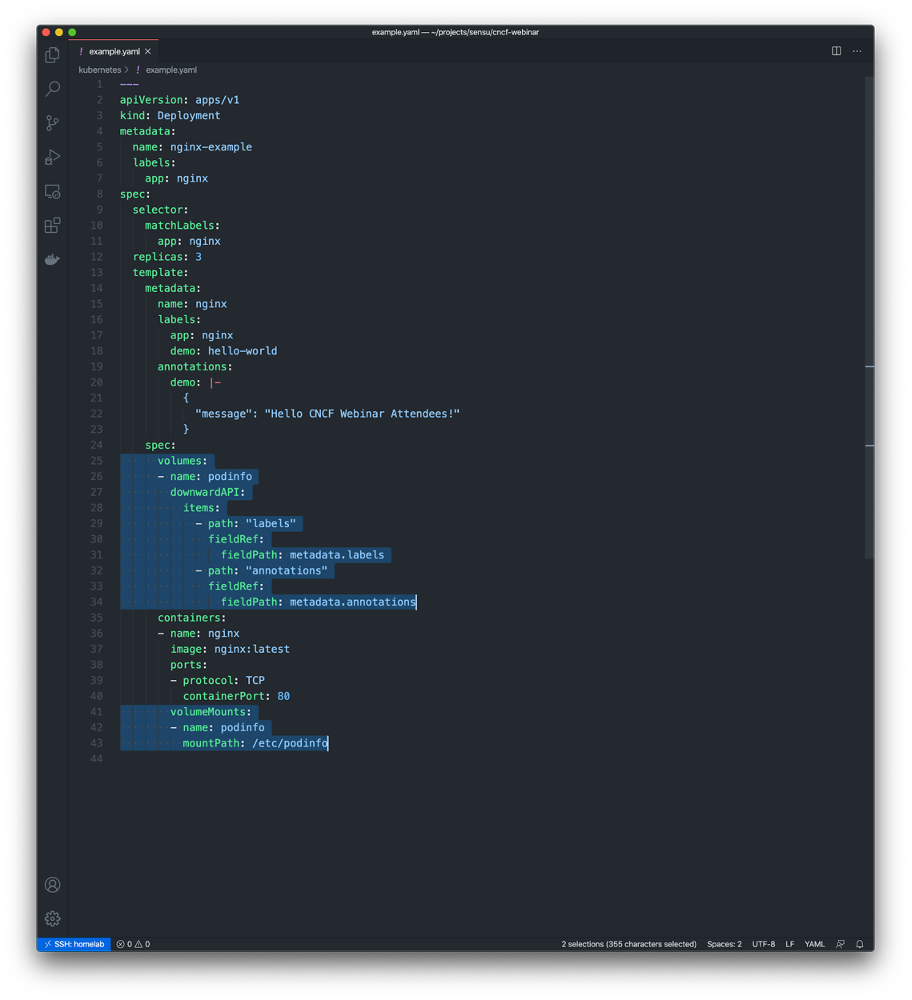
In this example I’m volume mounting files inside of a container using the Downward API. The end result will be a podinfo volume mounted at the path /etc/podinfo, with two files:
/etc/podinfo/labels – a flat file containing all of the pod labels (in key=value format)/etc/podinfo/annotations – a flat file containing all of the pod annotations (in key=value format)Alternatively, here’s a simple example of how to use the downward API to populate an environment variable value.
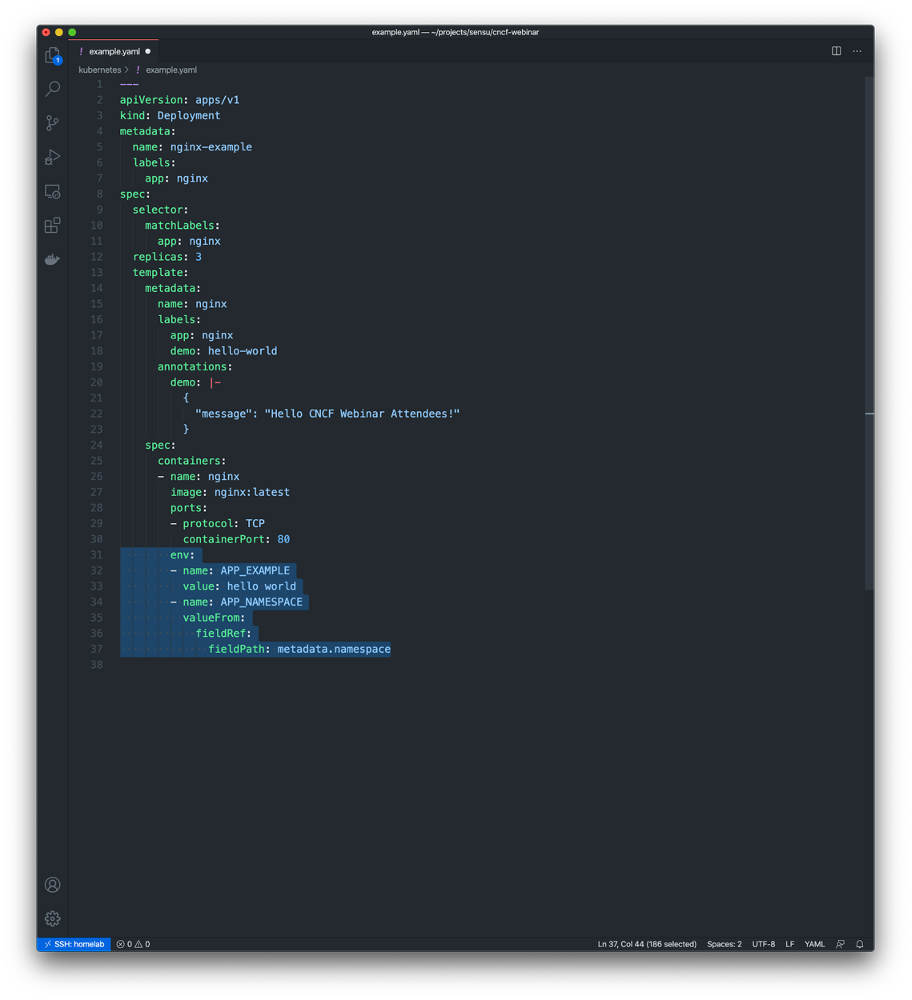
In this example I’m exposing the namespace the pod is running in as an environment variable called $APP_NAMESPACE inside the container. This is tremendously useful for exposing dynamic values to modern and/or legacy tools at predefined environment variables; e.g., if your observability tool expects an environment variable called $TOOL_SPECIAL_VALUE that should contain some value that we can extract from Kubernetes, the the Downward API is exactly the right tool for the job.
Here’s another simple demo — a live running container that was provisioned via the config file we just showed.
In this demo you can see a couple of example environment variables, and the /etc/podinfo mount path is a directory containing one file for each of the field lists – the labels file and of the annotations file. Note that it’s just one line per label or annotation, and key=value pairs, which are easy to parse from just about any programming language.
Now let’s move on to some richer examples, since one of the things that’s most interesting about the downward API is rich context for observability.
Here are some practical examples:
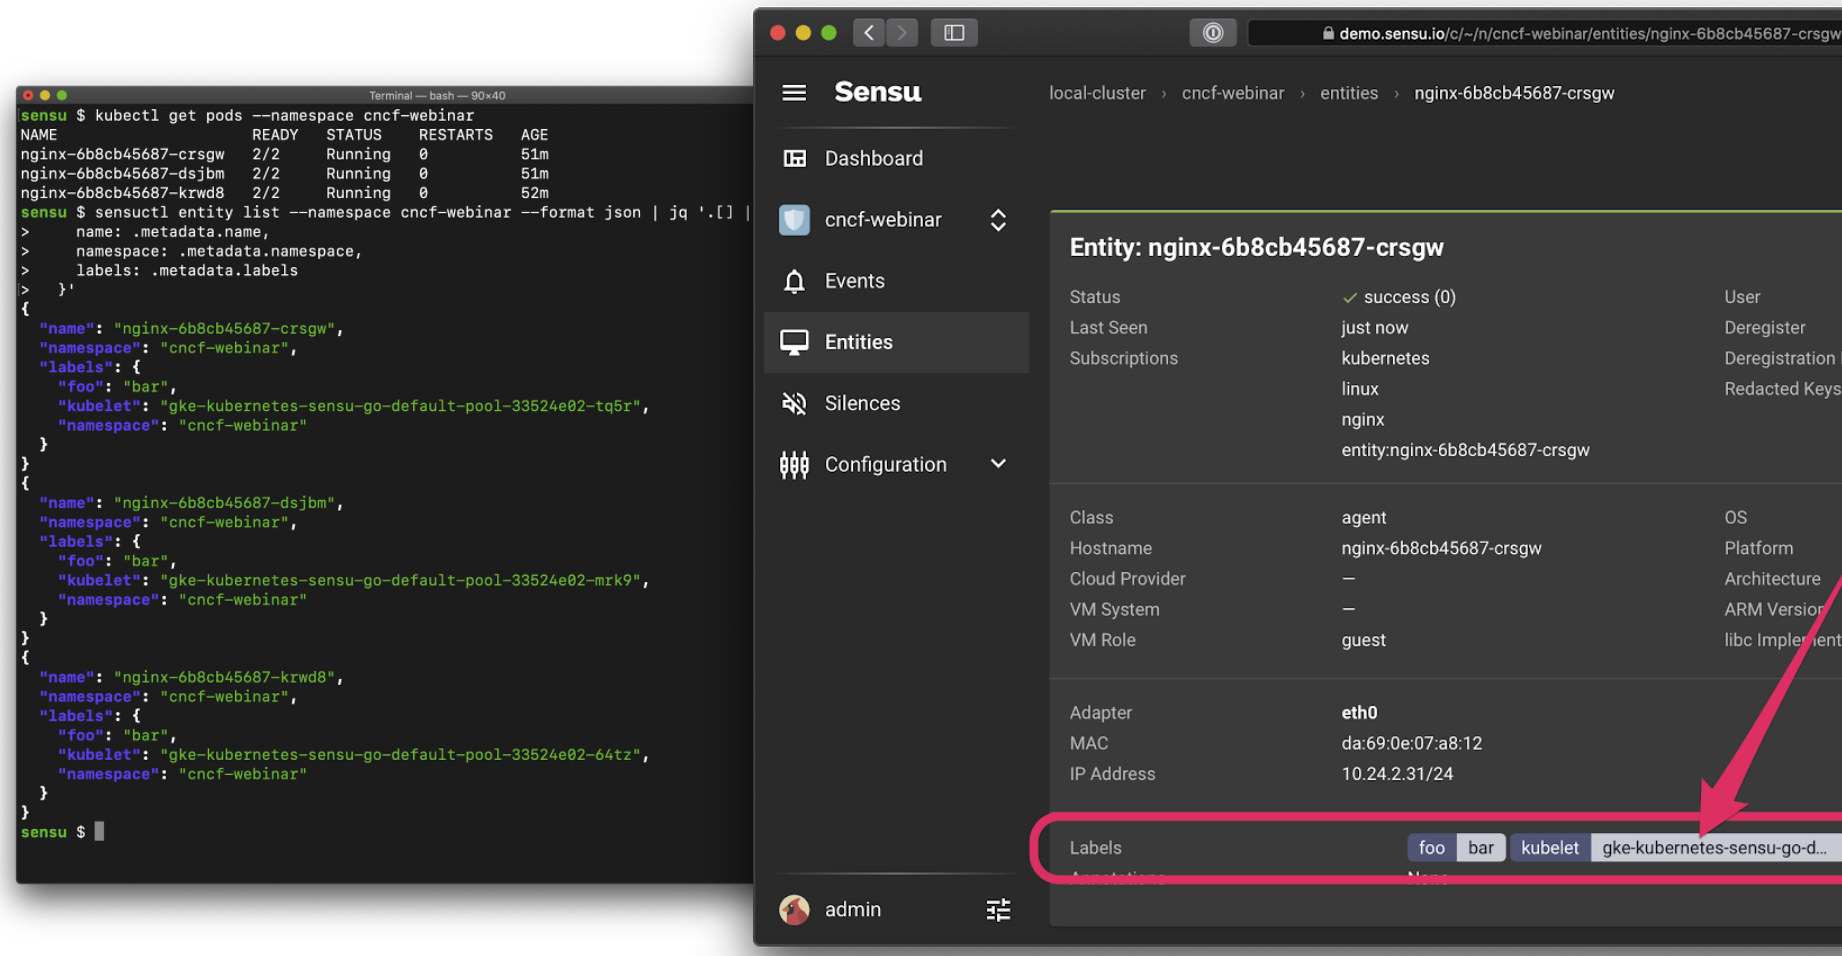 This is a screenshot of Sensu running, but it would work with other tools you could be using for observability.
This last screenshot is particularly interesting because it’s a simple Deployment with three replicas, and when Kubernetes scheduled the Pods it ended up running one on each of my three Kubelets. I didn’t specifically ask for that — Kubernetes made that decision for me – but having that context make its way into our observations (e.g., the events produced by Sensu) is really valuable for observability, especially when troubleshooting issues in a production context.
kubectl describe outputIn Kubernetes, events are a first-class resource. They give you information about what is happening inside a cluster or a given namespace, such as decisions made by the scheduler, or why some pods were evicted from the node.
If you already have a monitoring or observability solution in your Kubernetes environment, you might have seen data from this API, and you’ve definitely seen it if you’re troubleshooting deployments in Kubernetes. If you’ve ever used the kubectl describe pod command, you can see related events at the bottom of the output. That information is fetched from the events API.
Like every other first-class resource, events have metadata and status information available to them. Events record state changes, errors and other system messages for other resources. There are messages and attributes in these APIs that answer questions like “what’s the reason for this failure?” or “why did this break?” — which is exactly the sort of information we need to operate services on Kubernetes! Some simple examples of observability data you can obtain from the Events API includes ImagePullFailure, and CrashLoopBackOff events.
As with most APIs in Kubernetes, we can access Event API data using kubectl. You can use the kubectl get events command to request all events in the current namespace. One of the first things you might notice is that the Events API will return “Normal” and “Warning” events. Even at a small scale, the Normal event output can become overwhelming, because there are lots of normal events.
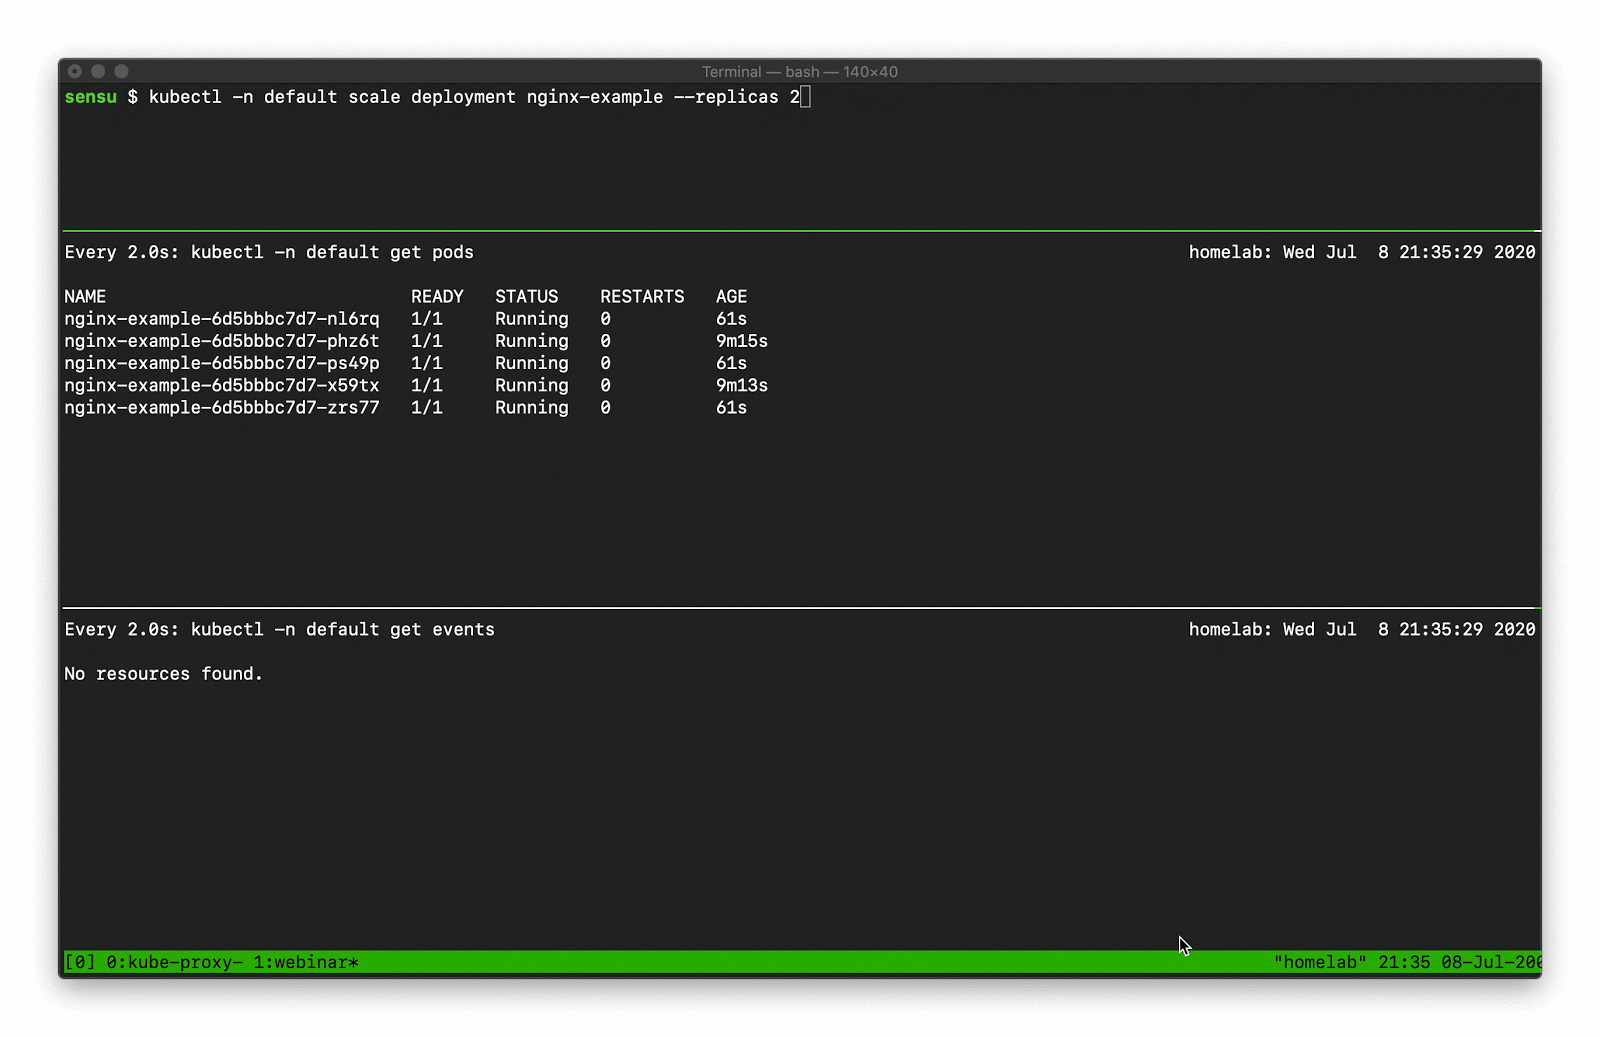
Let’s say, for example, you want to scale a Deployment. Recall that there are several moving parts, and a few degrees of separation between the controller (in this case, a Kubernetes Deployment) and the Pods. Kubernetes performs several actions in order to fulfill the request to scale a Deployment, including: creating or updating a ReplicaSet, scheduling/deciding which Kubelet each Pod should run on, verifying that the correct container images are cached/available on those Kubelets, and finally - start the Container… oh, and Kubernetes will then update any related Services (e.g., load balancers) so that they will send traffic to the new Pods. That’s a lot of steps! Every one of these actions will produce a “Normal” event (if successful), so you’re going to see a LOT of data come out of the events API. What can you do to make this useful? Well, you can filter the results with field selectors! Field selectors give you the ability to choose only Warning events, or only events from a certain resource type (e.g., “Deployment”, or “Service”).
In this example you can see how managing a single Deployment resource (creating and scaling the deployment) results in several “Normal” events just for the underlying “Pod” resources (not including several additional events for the related Deployment and ReplicaSet resources).
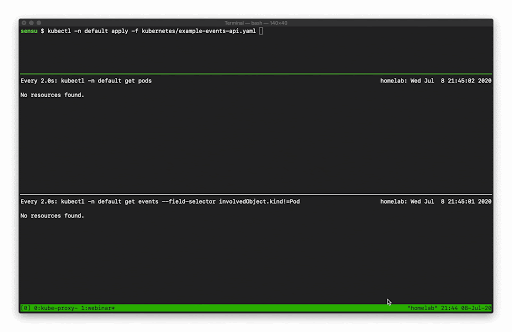
Now let’s see what happens if we exclude the Normal events.
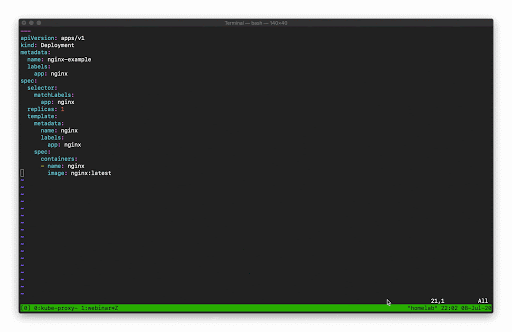
In this example I’m managing another Deployment resources, but this time my Deployment template is configured with an invalid Container image, so when I go to update that Deployment in Kubernetes it’s going to result in some errors.
Again, all of this event data we’ve shown coming out of the kubectl is just fetching from the Events API, so we can access all of this same information programmatically. Here’s an example to underscore this point:
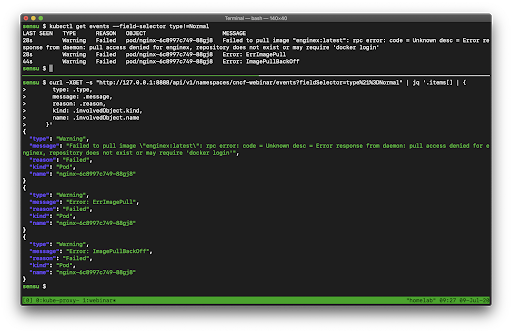
In this example, we are comparing the data we get from kubectl versus the exact same data from the Events API (via curl).
NOTE: Because the resources that come out of the API are extremely rich, there’s a lot of data here. I’m using jq to filter the API output and show the same properties I see from kubectl. Chris Short recommended during the presentation that once you learn all the kubectl commands you want to use, you should learn jq right after that – and I agree! It’s a swiss army knife for interacting with JSON APIs.
So that’s the Kubernetes Events API. It’s an incredibly rich resource full of critical data for monitoring and observability. If you aren’t already collecting Kubernetes Events as part of your cloud native observability strategy, it should be near the top of your priority list.
Our No. 1 Kubernetes API isn’t really an API at all. It’s a function of the Kubernetes API. Watchers are change notifications for any Kubernetes resource.
Watchers support resource instances and resource collections. When you run the kubectl get pods command or query the /pods API endpoint, you are fetching a Pod resource collection (i.e., a “list”).
GET /api/v1/namespaces/{namespace}/pods
GET /api/v1/watch/namespaces/{namespace}/pods?resourceVersion=123456789
GET /api/v1/watch/namespaces/{namespace}/pods/{name}?resourceVersion=123
These API endpoints return lists of Pods, which lists are themselves a resource type in Kubernetes. These lists are versioned, so we can record the version of that pod list and compare it with later versions to see what has changed over time.
Kubernetes API Watchers tell you if a resource has been ADDED, MODIFIED, or DELETED. And as we’ve explained above, the loosely coupled nature of Kubernetes results in a surprising number of resources changes that can be tracked using Watchers.
Note that you can use a watcher on the events API, combining these concepts to observe state changes. I illustrate this below:
In this example I’m using Kubernetes Watchers with the Pod API to observe changes to pod resources. When I delete a Pod that is managed by a controller (in this case, a Kubernetes Deployment), the controller will automatically replace the deleted pod with a new one – once again resulting in more changes than you might expect. To learn more about Kubernetes Pod state changes in the very excellent Kubernetes pod lifecycle documentation.
NOTE: If you haven’t played with the Kubernetes API before, you can get access to it with the kubectl proxy command. See the Kubernetes documentation for more information.
Kubernetes Watchers are a powerful tool for observing state changes in your Kubernetes clusters. And they’re not only useful for observing the building block resources (e.g., Service and Pods) – they can be combined with any Kubernetes API, including the Events API. If you’re experiencing a gap in your existing observability solution around resource changes that are impacting service reliability, Kubernetes Watchers might help fill that gap.
Just as we require actual visibility when we drive a car, or as surgeons rely on various tools to provide the necessary visibility into patient conditions when they perform operations on humans, so we as systems operators need to understand our systems if we want to run them efficiently and securely. We need a holistic view of everything that’s going on in Kubernetes — and there sure is a lot! We set up tools to give us observations, but are these tools giving us all the rich context we need? If you’re seeing any gaps in your observability strategy, then I hope you learned something here that you can use to fill those gaps and tune your existing solution. To the degree that you were already familiar with the kubectl commands I covered because you rely on them to diagnose issues with the workloads you’re running on Kubernetes, that might be a clue that there are gaps in your current Kubernetes observability strategy. The good news is, those kubectl commands are just talking to the underlying Kubernetes APIs, which means we can collect this data using our observability tools and spend more time improving our systems (instead of spelunking around Kubernetes because we’re missing context).

Made with #monitoringlove by SensuTM in Canada 🇨🇦 and the USA 🇺🇸. © 2017-2021 – Privacy Statement – Terms & Conditions