Your registration has been confirmed. Thank you for signing up!
In this guide, you’ll learn all about alert fatigue — including the common pitfalls and costs to your business — as well as real-world steps to mitigate.
Ben Abrams is a technology veteran with over 10 years’ experience, primarily as a systems engineer (or whatever fancier title they give him). Ben has helped startups, SMBs, and large enterprises achieve their goals through effective use of technology. While Ben has often been categorized as a “hardcore generalist” he largely focuses on system architecture, automation, CI/CD, security, and monitoring. Ben has a special place in his heart for OSS; he contributes to and maintains various projects, including Sensu. In his “spare” time he enjoys playing with his dog Ender, playing video games, and watching anime.
Sensu Inc. is the creator and maintainer of Sensu, the open source monitoring event pipeline. Founded in 2017, Sensu empowers businesses to automate their monitoring workflow and gain deep visibility into their Kubernetes, hybrid cloud, and bare metal infrastructure. Backed by one of the largest open source communities in monitoring, companies like Sony, Box.com, and Activision rely on Sensu to help them deliver value to their customers faster, at larger scale. Sensu maintains the free and open source Sensu Go as well as commercially supported features for enterprise, which include best-in-class support and integration with industry standard tools to simplify operations and governance for monitoring at scale. Headquartered in Portland, Oregon, Sensu currently operates as a fully distributed team, with employees located throughout the United States and Canada. For more information, follow @sensu on Twitter or visit https://sensu.io.
In this guide, you’ll learn about alert fatigue — including the common pitfalls and costs to your business — as well as real-world steps to mitigate. Seasoned IT veteran Ben Abrams will walk you through the implications of alert fatigue, how to rethink your organization’s approach, and illustrate mitigation techniques drawing on the Sensu monitoring event pipeline.
Sensu is 100% open source and free to use, and it’s easy to get up and running quickly. Check out the quick-start guide to follow along.
If you’re not familiar with alert fatigue, here’s the short version:

Alert fatigue occurs when one is exposed to a large number of frequent alarms[1] (alerts) and consequently becomes desensitized[2] to them.
This problem is not specific to technology fields: most jobs that require on-call, such as doctors, experience it in slightly different manners, but the problem is the same.
In our industry, the following are common costs of engineers or operators experiencing alert fatigue:
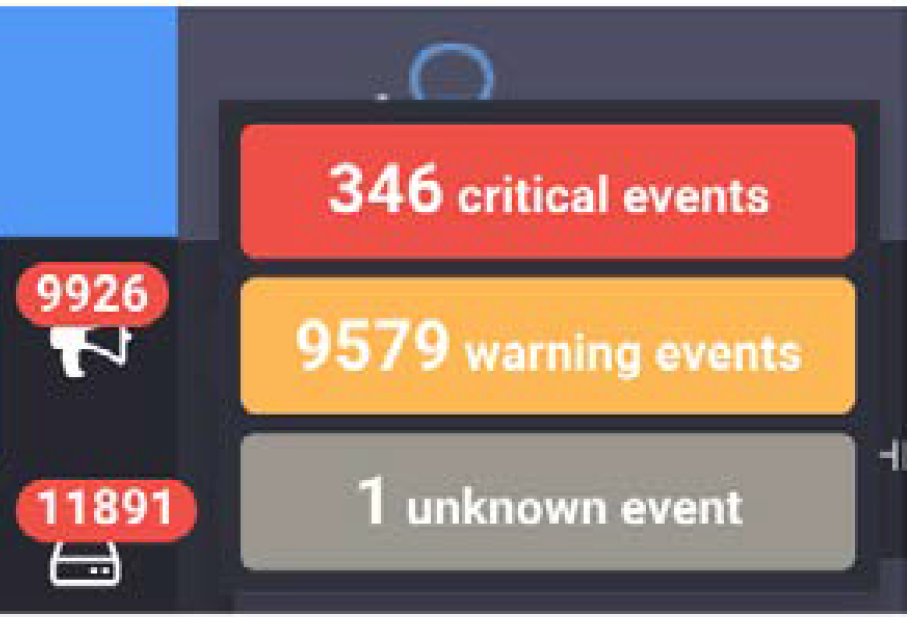
This screenshot was taken from a real production system (I did not hack the JavaScript in the dashboard to inflate) and demonstrates how the multitude of alerts can make it impossible to prioritize fixing issues.
Addressing (and eliminating) alert fatigue isn’t just about having the right tooling in place (but I’ll get to that later). By rethinking how you approach monitoring and alerting, you can make huge strides:


These are some great first steps for rethinking how you approach alerting. Next up, I’ll cover the features Sensu offers to help reduce the number of alerts you’re getting.
Now that we’ve laid the foundation for rethinking alerting, let’s take a look at the various features Sensu offers to reduce the number of alerts you receive — without reducing what you’re monitoring. We’ll cover:
You might be thinking, “Isn’t that what you use to specify secrets?” but token substitution has many use cases, such as setting per-node thresholds.
Take the following example of a Sensu check definition:
{
  "checks": {
    "check_cpu": {
      "command": "check-cpu.rb -w \":::cpu.warn|80:::\" \
        -c \"cpu.crit|90:::\" --sleep 5",
        "subscribers": ["base"],
        "interval": 30,
        "occurrences": ":::cpu.occurrences|4:::"
    }
  }
}
::
The ":::token|default:::" syntax allows us to use a client configured value and otherwise use the default. Here’s an example of an ETL node that needs to set thresholds to accommodate its workload:
{
    "client": {
    "name": "i-424242",
    "address": "10.10.10.10",
    "subscriptions": ["base", "etl"],
    "safe_mode": true,
    "cpu" {
        "crit": 100,
        "warn": 95,
        "occurrences": 10,
        }
    }
}
In Sensu 1.x, filters are incredibly powerful and can be used to determine if a mutator or handler is run. Both mutators and handlers are computationally expensive, so adding a filter reduces the load on the Sensu server(s), thereby reducing the alerts from the Sensu server itself. Handlers can be used for automating pretty much any process, although they are most commonly used to notify responders via communication channels such as Slack, email, PagerDuty, etc.
Filters can be inclusive or exclusive:
Inclusive filtering allows mutators and handlers to run if the condition of the filter matches. It’s controlled by setting the filter definition attribute “negate”: false. The default is inclusive filtering.
The following is an example of a filter designed to only alert from 10am to 10pm Eastern Time:
{
  "filters": {
      "ten_to_ten_eastern": {
      "negate": false, # default: false
      "attributes": {
        "timestamp": "eval: ENV[‘TZ’] = ‘America/New_York’; \
        [1,2,3,4,5].include?(Time.at(value).wday) \
        && Time.at(value).hour.between?(10,22)"
      }
    }
  }
}
In this example, we’re leveraging a Ruby function called eval which allows executing arbitrary Ruby. As our servers store their time in UTC, we set our timezone (to avoid having to look up timezone values) and check if the event fired during the specified days and hours. As many places in the United States have daylight saving time, this means we don’t have to adjust our timezone settings twice a year.
Exclusive filtering prevents mutators and handlers from being executed. It’s controlled by setting the filter definition attribute "negate": true.
The following is an example of a filter designed to avoid proceeding in the event pipeline when the number of occurrences of the current state is greater than the check’s occurrences attribute value. A token substitution fallback of 60 is used if the check does not define an occurrences attribute.
{
  "filters": {
    "occurrences": {
      "negate": true,
        "attributes": {
          "occurrences": "eval: value > :::check.occurrences|60:::"
        }
      }
   }
}
In many cases — as you’re monitoring a particular state of a system — you probably know some steps to triage or in some cases automatically fix the situation. Let’s take a look at how we can automate this using check hooks and handlers.

Some reasons to automate this include:
I worked with Sensu CTO Sean Porter to design check hooks, an awesome Sensu feature that allows you to run a command client side based on the status code of the check/event. This is a great way to bring contextual awareness into the alert before sending it off to your on-call engineer. One use case includes checking connectivity to your default gateway when outside connectivity has been cut from an instance.
Example:
{
  "checks": {
    "ping_four8s": {
      "command": "check-ping.rb -h 8.8.8.8 -T 5",
      "subscribers": ["base"],
       "interval": 5,
       "hooks": {
         "non-zero": {
           "command": "ping -c 1 `route -n | \
             awk ‘$1 == \"0.0.0.0\" { print $2 }’`"
          }
        }
     }
  }
}
You might be thinking, “Well that’s cool, and looks like it’s useful to go beyond triage and jump right into auto remediation.” You would not be alone in this assumption, but check hooks have some disadvantages to other approaches. The biggest disadvantage is that check hooks run client side and therefore lack any context beyond “this was the status of the last run command.” For example, if you had a check hook that would restart the service if the process is not running, that may have unintended consequences. Let’s say you have to stop said process to perform some kind of offline maintenance (and you’re also “not an asshole”), so you decide to create a silence to prevent it from alerting the on-call engineer. The problem is, the client has no access to this context and will restart the process when it detects it’s down, which could leave you in a bad state. “OK,” you’re thinking. “That makes sense. So how do I do auto remediation properly then?” Read on…
In Sensu, a handler is a piece of code that runs whenever the Sensu event pipeline deems it should. It can do anything (sending metrics, notifications, and for auto remediation, to name a few); let’s look at how we can leverage some Sensu internals with a handler.
There are essentially two parts to the config after you’ve installed the remediator handler from the somewhat goofily named sensu-plugins-sensu gem.
Let’s start with defining our check configuration:
{
  "checks": {
    "check_process_foo": {
      "command": "check-process.rb -p foo",
      "subscribers": ["foo_service"],
      "handlers": ["pagerduty", "remediator"],
      "remediation": {
        "foo_process_remediate": {
          "occurrences": ["1-5"],
          "severities": [2]
         }
      }
    }
  }
}
The majority of this check definition is pretty standard setup, so let’s focus on the portion in the remediation object. Aside from adding the remediator handler to it, we define foo_process_remediate and tell it to only run when its occurrences are between 1 and 5 and on critical (status code 2) events.
Note: if you’re unfamiliar with Sensu check definition, check out their documentation.
For the second portion, we need to leverage a not very well known feature of Sensu: the “unpublished check,” which essentially means that the Sensu scheduler will not schedule the check on an interval even if defined and will only run when an event triggers it to run. This can be used either for fully automated remediation or to create automated fixes that an engineer can fire off with an API call (after verifying the situation and believing the issue will be resolved with a particular set of remediation). This is controlled by the publish key, which by default has a value of true, meaning Sensu will automatically schedule it.
For example:
{
  "checks": {
   "foo_process_remediate": {
      "publish": false,
      "command": "sudo -u sensu service foo start",
      "subscribers": ["foo_service", "client:CLIENT_NAME"],
      "handlers": ["pagerduty"],
        "interval": 10,
    }
  }
}
The command in the example is the command you wish to run to fix the issue— in this case, starting the service as the Sensu user. In a moment, I’ll cover giving limited escalated privileges to Sensu. For example:
You might be wondering what’s up with that whacky subscription of client:CLIENT_NAME. The client: represents the internal Sensu subscription that it makes for each client for every subscription designated for the client. I originally omitted this in my first implementation of this in my environment and was in for a fun surprise: when a failure was detected on one client, it restarted the service on all clients with the matching subscription name, which meant all my web servers restarted — causing a minor outage. I learned my lesson: I restricted the remediation to the affected client and it works perfectly.
We also want to specify an alert handler in case the remediation fails, like we do with PagerDuty in the example above.
In order for the Sensu process to be able to restart the foo service, we need to configure our system to allow that, as the foo service is owned by the foo user — because running everything as root is a bad idea.
We turn to the good old suders configuration to accomplish this. The command will change depending on what process manager you’re running on the system. Here’s an example for both sysv-init and systemd to allow starting or restarting select commands…
sensu ALL=(root) NOPASSWD:/usr/sbin/service service foo start
sensu ALL=(root) NOPASSWD:/bin/systemctl start collector
sensu ALL=(root) NOPASSWD:/bin/systemctl restart collector
sensu ALL=(root) NOPASSWD:/bin/systemctl start chef-client
sensu ALL=(root) NOPASSWD:/bin/systemctl restart chef-client

While you can write this into the /etc/ sudoers file directly (via the visudo command), I suggest writing it to /etc/ sensu/conf.d/sensu with your config management of choice to keep it clean and avoid issues when upgrading system packages. There[4] are[5] many[6] resources for breaking down the syntax of sudoers config, but the short version is that we let the sensu user execute those commands without requiring a password. Be careful with wildcards as this can lead to argument expansion attacks[7].
To continue setting up remediation, you’ll need to define the handler as well as some pieces to the client.json configuration. Assuming the plugin lives in /etc/sensu/plugins/sensu-remediator.rb, the handler config should be:
{
  "handlers": {
     "remediator": {
      "command": "/etc/sensu/plugins/sensu-remediator.rb",
      "type": "pipe",
      "severities": [
        "critical",
        "Warning"
     ]
   }
 }
}
The handler must include the subscription we previously defined:
{
  "client": {
    "address": "10.10.10.10",
    "name": "i-424242",
    "safe_mode": true,
    "subscriptions": [
      "base",
      "foo_service"
    ]
  }
}

In the next chapter, I’ll go into tips for cutting down on the sheer number of alerts you’re getting.
So far, we’ve covered alert reduction with Sensu filters and token substitution; automating triage; and remediation with check hooks and handlers. In this chapter, I’ll cover alert consolidation via round robin subscriptions and JIT/proxy clients; aggregates; and check dependencies.

These are all designed to help you cutthrough the “white noise” and focus on what’s important (especially in the middle of a major incident).
The below screenshot was from my first week on-call at Doximity: we were alerted that our auth service endpoint was failing health checks from every single node.
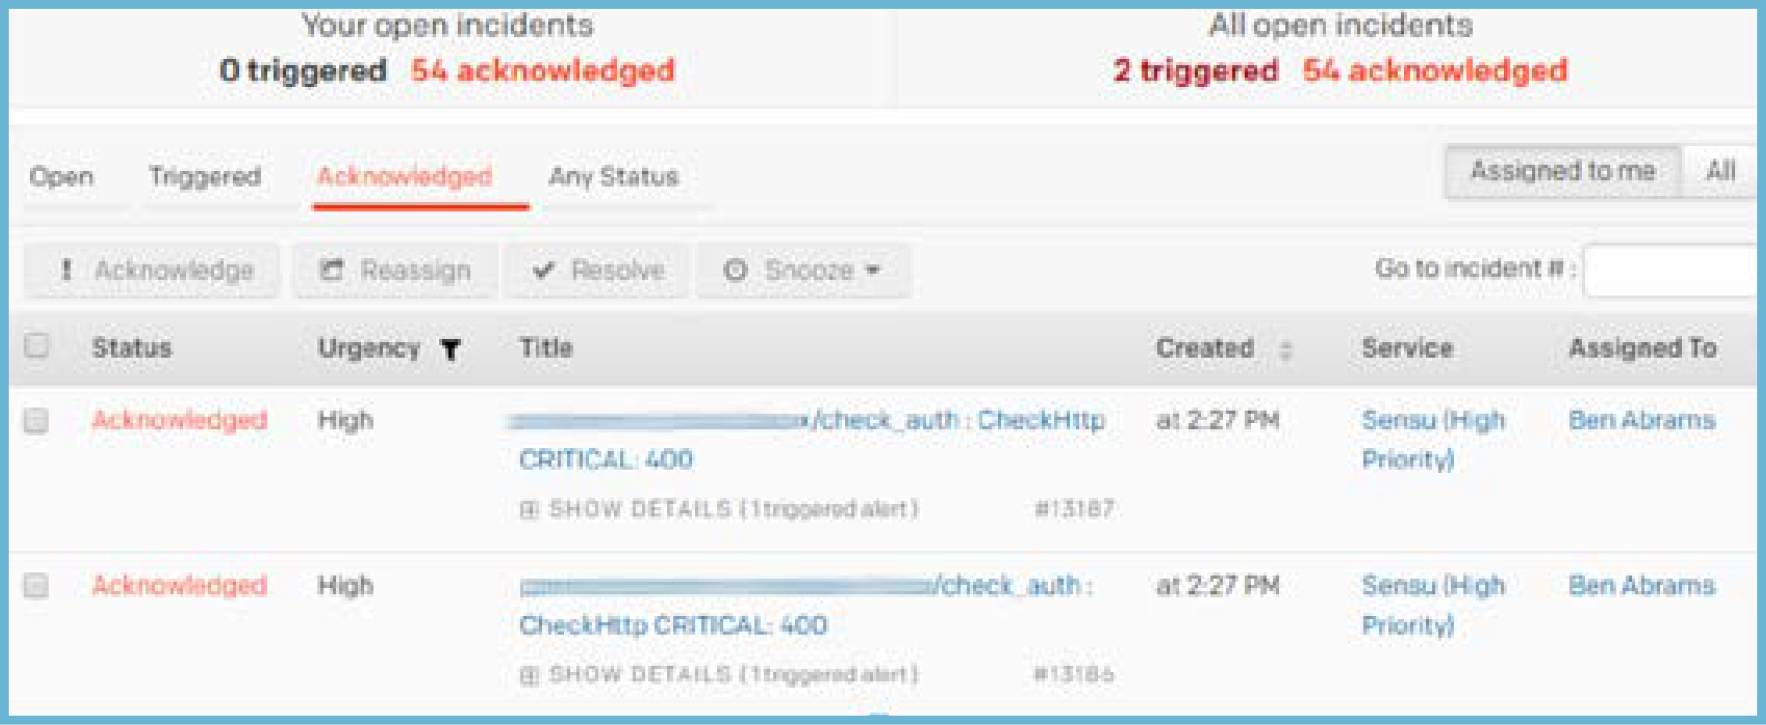
It turned out that this was due to an application deploy that removed a healthcheck that we were apparently not supposed to monitor, which meant there was actually no service disruption. I got 52 of the exact same alert, but we could have taken those alerts and made them only one using a couple of pretty straightforward features in Sensu. There are actually two approaches to take — let’s look at each of them in a bit of detail.
Proxy (formerly known as “Just In Time”) clients allow you to run the check from one location and create a client for the external service. This is extremely handy for monitoring services where getting an agent in the box is difficult or when checking an external entity.
Round robin subscriptions work very similarly to traditional round robin checking or load balancing. For most use cases, you won’t notice that it’s not true round robin, but you may notice it seems to favor one node over another. You’re not crazy (at least I should say this does not confirm nor deny your craziness); what happens is that Sensu fires an event and drops it into RabbitMQ. Any nodes that match the subscription can pull it, and it’s first come first serve. In a setup where you have equal hardware profiles, local network, etc., you will not notice the nuance, but if you’re round robining from two nodes across a WAN, the one that has better throughput and latency will likely end up “winning” it more often than the other.
For example, we’re monitoring an Elasticsearch 5 cluster status. As this is something achieved via quorum and a remote API, checking from every single instance in the cluster will yield the same results. This is similar to the auth situation I mentioned a few paragraphs ago. By combining a proxy check with a round robin subscription, we can allow the check to be executed one at a time from any of the nodes but report it as a single client, so our number of alerts go from n nodes to a single alert.
Here’s an example:
{
  "checks": {
    "check_es5_cluster": {
      "command": "check-es-cluster-status.rb -h :::address:::",
      "subscribers": ["roundrobin:es5"],
      "interval": 30,
       "source": ":::es5.cluster.name:::",
       "ttl": 120
     }
  }
}
By simply adding roundrobin:es5, we’re telling this check to be scheduled on any node with the subscription of es5. The source attribute tells us the name of the client it will create in Sensu, which can be alerted on separately from the node that executed the check. As we had multiple elasticsearch5 clusters
(logging and application), we used a token substitution to set the name to the cluster name. An important thing to keep in mind with proxy checks is that since there is no agent running, you don’t get a free keepalive check, so we use the ttl option to tell us to alert if no client has published its results in the last two minutes.
We just need the matching subscription in our client.json:
{
   "client": {
      "name": "i-424242",
      "address": "10.10.10.10",
      "subscriptions": ["base", "roundrobin:es5"],
      "safe_mode": true
     }
}
Honestly, aggregates are awesome. I tend to think of them in terms of having a bunch of nodes behind a load balancer where each node is healthchecked, and if a node drops out it may not be worth waking someone up in the middle of the night. Because Mike Eves did a fantastic job going into a lot of detail in his post (you should check it out), I’m going to keep it brief.
Similar to the remediator solution, this requires a couple of components.
We start with defining a check (much like many others) and add the aggregates key. See the below example:
{
  "checks": {
    "sensu_rabbitmq_amqp_alive": {
      "command": "check-rabbitmq-amqp-alive.rb",
      "subscribers": ["sensu_rabbitmq"],
 			"interval": 60,
      "ttl": 180,
      "aggregates": ["sensu_rabbitmq"]
      "handle": false
    }
  }
}
The aggregates key tells Sensu to create a namespace called sensu_rabbitmq which we’ll use to query later. Each machine in the sensu_rabbitmq subscription will run the check and push their results under this namespace.
Next, we define a check to query the results in the namespace, as in the following example:
{
  "checks": {
    "sensu_rabbitmq_amqp_alive_aggregate": {
      "command": "check-aggregate.rb --check sensu_rabbitmq_amqp_alive --critical_count 2 --age 180",
      "aggregate": "sensu_rabbitmq",
      "source": "sensu-rabbitmq",
      "hooks": {
        "critical": {
          "command": "curl -s -S localhost:4567/aggregates/sensu_rabbitmq/results/critical | jq .[]. check --raw-output",
        }
      }
    }
  }
}
We’re checking that at least two or more nodes are in a critical state before alerting. As we lose the context in this aggregate query, let’s leverage the check hook and the Sensu aggregates API to add the critical results to the event. This check comes from the same sensu-plugins-sensu gem as the remediator.
The last technique I want to talk about solves a different pattern of problems than the previous ones: we want to focus on getting the most relevant alert to the responder so they can focus on root causes rather than symptoms.
Check dependencies are facilitated by a Sensu Core filter extension[8]. They allow you to prevent mutators and handlers from acting on events if their dependencies fail. You can use specific checks or even whole subscriptions.
Here’s an example of a check depending on another check:
{
  "checks": {
   "check_foo_open_files": {
      "command": "check-open-files.rb -u foo -p foo -w 80 -c 90",
      "subscribers": ["foo_service"],
      "handlers": ["pagerduty"], "client:CLIENT_NAME"],
      "dependencies": ["client:CLIENT_NAME/check_foo_process"]
    }
  }
}
In this example, we’re monitoring the foo process for number of open file descriptors in use, as this process has a habit of having leaks. We can’t check how many files it has open if the process is not currently running, so we create a relation with the dependencies key. In this case — since the relation is local— we use the same syntax as previously used with the remediator handler. If you had a web service that depended on a database service, you could use the appropriate subscription removing the client:CLIENT from the object.

So far, we’ve covered alert reduction with Sensu filters and token substitution; automating triage; and remediation with check hooks and handlers. In this chapter, I’ll cover alert consolidation via round robin subscriptions and JIT/proxy clients; aggregates; and check dependencies.
In my experience, flap detection is more of a tune by instinct and observations versus pure math. Sensu uses the same flap detection algorithm as Nagios[9].
There are two levers to tweak until happy:
{
  "checks": {
    "check_cpu": {
      "command": "check-cpu.rb -w 80 -c 90 --sleep 5",
      "subscribers": ["base"],
      "interval": 30,
      "low_flap_threshold": ":::cpu.low_flap_threshold|25:::",
       "high_flap_threshold": ":::cpu.high_flap_threshold|50:::"
     }
  }
}
As with other settings, you can use default thresholds and override specific clients with different workloads.
Maintenance is part of our everyday lives, and while we strive to always provide a zero downtime maintenance, sometimes it’s unavoidable. Be a good citizen on your team and silence the checks and clients you know you’re updating to avoid alerting the on-call engineer. Failure to do so may result in your teammates being unhappy with you and branding you an “asshole.” Sensu provides an API for silencing subscriptions and checks, and in version 1.2 on, they allow you to specify a start time for your scheduled maintenances.
Maintenances should typically start with creating a silence:
$ curl -s -i -X POST \
-H ‘Content-Type: application/json’ \
-d ‘{"subscription": "load-balancer", \
"check": "check_haproxy", "expire":
3600, "begin": "TIME_IN_EPOCH_FORMAT", \
"reason": "Rolling LB restart" }’ \
http://localhost:4567/silenced
HTTP/1.1 201 Created
Access-Control-Allow-Credentials: true
Access-Control-Allow-Headers: Origin, X-Requested-With,
Content-Type, Accept, Authorization
Access-Control-Allow-Methods: GET, POST, PUT, DELETE, OPTIONS
Access-Control-Allow-Origin: *
Connection: close
Content-length: 0
The above curl command illustrates how easy it is to create a silence. Please note the expire key: never submit this without a specific deadline, as it will surely come back to bite you later. I have seen it happen where we had an impact but no one was alerted. I recommend silencing for no more than 24 hours at a time. You can also leverage the expire_on_resolve key which does what it sounds like.
Of course, you can also use Uchiwa to schedule silences if you are one of those GUI-inclined folks.
This is a feature I had to sadly omit from the talk to make it fit in the time allotted. It’s honestly more of a security feature, but has a useful side effect for helping with alert fatigue. Safe Mode informs the client that it may only execute a subscription check from the server if the check definition on the server exists as well on the client side. This helps protect against an attacker with a foothold in your environment from using Sensu to execute malicious checks and spread to other nodes. Wondering how this relates to alert fatigue? Let’s say you have a process where machines start from a base image and then have additional provisioning tools such as Chef, Puppet, Ansible, etc. that bring the node into the desired state. That process may not be instantaneous: when the Sensu client sees the node and matches the subscription, it starts scheduling checks immediately, perhaps before the system provisioning has finished updating the check definitions, monitoring plugins, or other services required to satisfy check requirements. Safe Mode makes sure that we prevent checks, mutators, and handlers from firing until the definition is set up, which reduces the window of opportunity to alert on a non issue. It’s a great feature that solves multiple problems at once.
Configuring Safe Mode is quite easy: you just enable the following in your
client file (typically located in /etc/sensu/conf.d/client.json):
{
  "client": {
    "name": "i-424242"
      "address": "8.8.8.8",
      "subscriptions": ["dns_lb"],
      "safe_mode": true
   }
}
And then add your check definitions to the server and the appropriate clients.
Technically Sensu comes with good defaults for handler configuration — here’s an example of modifying some defaults that would make a particular handler action on additional events:
{
  "handlers": {
   "single_pane": {
      "type": "pipe",
      "command": "single_pane.rb --message ‘sensu event’ https://domain.tld:port",
      "handle_silenced": true,
      "handle_flapping": true
    }
  }
}
In this scenario, we’re not alerting or remediating anything and are using a single pane of glass service (such as BigPanda), so therefore we want to receive flapping and silenced events
I hope that you found these tips useful for reducing your alerts and improving your engineers’ happiness at work. And, while this series offers a curated tour of Sensu capabilities targeted at reducing or eradicating alert fatigue, there are a lot of other great Sensu features to explore. I wrote this series in context of Sensu 1.x, but many of the features have been moved into Sensu Go and in many cases improved upon. I hope to go over these in the future, but the one feature that changes drastically in its power and ease of use is filters, as you can’t leverage Ruby’s eval or otherwise similar function, since golang is a compiled language. Work is being done by the Sensu Community and engineering team to make this both easier and better to use, and you can accomplish most of the same things writing a gRPC client.
Stay tuned for how to reduce alert fatigue with Sensu Go, and for now — happy monitoring!
https://en.wikipedia.org/wiki/Desensitization_(psychology) ↩︎
https://blog.rapid7.com/2016/05/03/6-lessons-i-learned-from-working-in-a-soc/ ↩︎
https://www.digitalocean.com/community/tutorials/how-to-edit-the-sudoers-file-on-ubuntu-and-centos ↩︎
https://blog.compass-security.com/2012/10/dangerous-sudoers-entries-part-4-wildcards/ ↩︎
https://github.com/sensu/sensu-extensions-check-dependencies ↩︎
https://assets.nagios.com/downloads/nagioscore/docs/nagioscore/3/en/flapping.html ↩︎

Made with #monitoringlove by SensuTM in Canada 🇨🇦 and the USA 🇺🇸. © 2017-2021 – Privacy Statement – Terms & Conditions