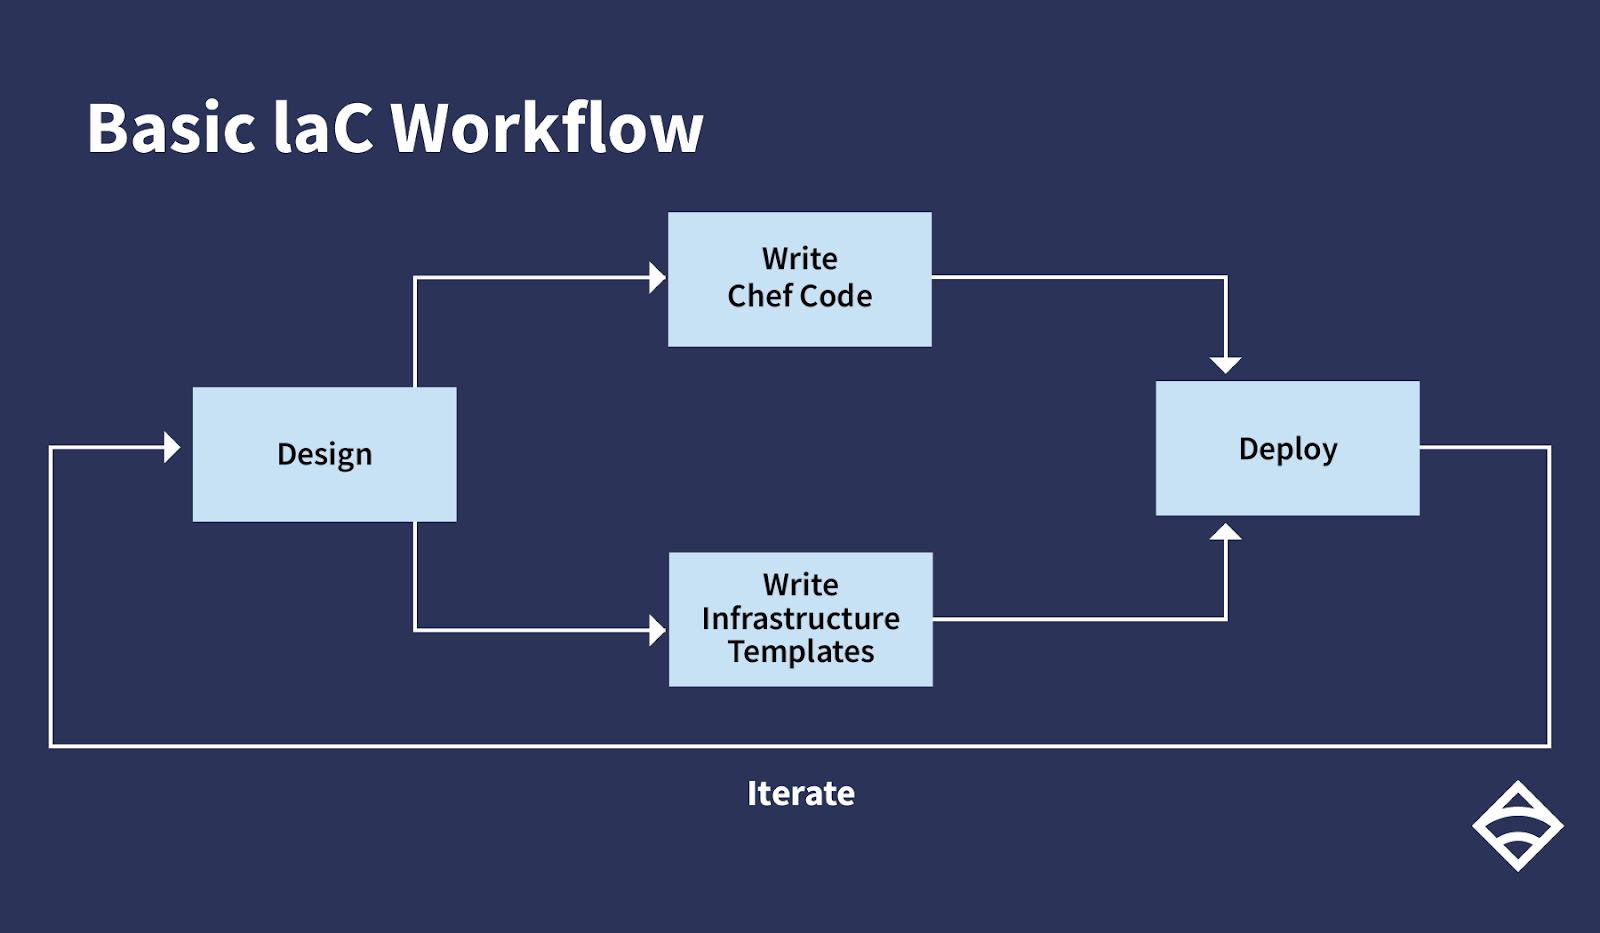
In my last post, I talked about the evolution of infrastructure as code and its role in modern software development. To recap, let’s take a quick look back at what an IaC process establishes: in a nutshell, IaC is a methodology that enables you to manage your servers and deploy your applications purely through code. Through some configuration language saved to a file, you define the resources and packages that servers need. These files can be checked into source control, and establish consistent behavior for your application across all of its environments, whether that’s production, staging, or a local dev machine. A basic IaC workflow might look something like this:

Essentially, you come up with a top-level design of your infrastructure: what are you trying to achieve, and what services do you need to provide? You declare the dependencies that your applications need, everything from disk partitions, system packages, dependent services, and so on (e.g., if I have a web application, it depends on Apache, Memcache, and mysql, to name a few). In parallel to that, you’d typically be writing code to provision your infrastructure as well, whether that’s cloud resources or virtual machines on bare metal. That code is then reviewed and deployed into the world. Over time, as your application grows and its requirements change, these steps are iterated on over and over again.
Implementing an IaC workflow enables your ops teams to treat the provisioning of servers and resources the same way application developers manage the code that builds your application. Ultimately, this leads to a DevOps workflow: by writing code that manages your infrastructure, you can provision servers in repeatable and reliable ways.
In this post, I’ll explore that guarantee a little further and demonstrate the power of including monitoring as part of this workflow. Implementing IaC isn’t enough; you must also continuously test and monitor your deployments, unlocking your potential to move faster, safely.
The same rules apply
When it comes to pure software, we know how important it is to test an application before it’s released. We want to ensure that the features we build actually behave the way we intended. Furthermore, as our application changes, a proper test setup ensures that nothing we add will break our existing behavior. After an application goes live, monitoring is the next step in verifying the logic of our code. As users interact with the app, developers can categorize and react to problems that they weren’t aware of. In other words, the goal of testing is to protect against known issues — like how the application should respond if a user tries to upload a file that’s too big — and the goal of monitoring is to protect against unknown issues — like what happens if too many users attempt to upload files at the same time.
With your infrastructure provisioning now available as code, you can also test and monitor that logic, just as you would for your application’s behavior. Monitoring allows you to extend testing into production.
Test and test again
When it comes to testing tools for IaC, there are many options out there. I’ll go over two of the ones I like best, simply because you can also run them in production (which I’ll get to below).
Serverspec provides a lot of helpers to test the behavior of your servers. Written in Ruby, it provides a DSL for ensuring that services are started and enabled, as well as checking whether processes are running. You can even test that your infrastructure has the correct number of CPUs or memory allocated.
A sample test that ensures that an httpd service is running on a specific port might look like this:
require "spec_helper"

describe service("httpd"), if: os[:family] == "red_hat" do
  it { should be_enabled }
  it { should be_running }
end

describe port(80) do
  it { should be_listening }
end
One key benefit that Serverspec provides is platform-specific logic handling. If you’re targeting several different platforms, being able to run suites specific to the operating system (as we’re doing here with os[:family]) is crucial.
The Bash Automated Testing system, or Bats (note: this project is no longer actively maintained), is similar in nature to Serverspec, but it’s a test suite written in, well, Bash. It’s a little less friendly to write, but it might be more appropriate to implement within an organization without Ruby experience:
#!/usr/bin/env bats

@test "httpd should be running" {
  run service httpd status
  ["$status" -eq 0]
}

@test "httpd should be listening for connections" {
  ["$(netstat -plant | grep http)"]
}
In lieu of much syntactic sugar, your test suite relies on all the command line tools available to your base platform.
With either of these tools, you’ve got a pretty good safety net for validating your DevOps configurations before releasing anything into production. The next optimization is to implement a monitoring pipeline to observe your servers’ behavior in the wild.
Monitoring for today’s infrastructure
Modern server architecture is rarely standardized across organizations. Some groups choose to use ephemeral EC2 instances, beginning with hundreds of servers in the morning, scaling to thousands in the afternoon, and dropping back down to dozens in the evening in order to handle load and computationally intensive actions. Others may decide that a cluster of Kubernetes nodes suits them, or even a hybrid-cloud architecture. Accurately monitoring your services’ health across the various platforms can be a challenge.
Sensu was created out of this need to monitor dynamic and varied infrastructures and uses open source plugins to tie into your other DevOps tools. The input and output formats of these plugins are standardized to a spec, so you don’t need to worry about managing the actual nitty gritty of how the plugin runs. Sensu also provides a REST API to allow you to query endpoints for information about all of your servers and services.
This monitoring works through the use of Sensu checks, executable scripts and commands that are simple to write and understand for both application developers and operations engineers. Sensu checks are executed by Sensu agents across your fleet. At its core, a Sensu check runs a command at an interval you’ve defined. They write to standard out and return a status code to indicate the severity of a message, which can then be routed to whatever notification system you have configured. Checks can be used to monitor server resources, infrastructure components such as your databases, or overall availability of a service.
Defining a Sensu check in the Chef DSL looks something like this:
sensu_check "api_http_response" do
  command "check-http.rb -u https://127.0.0.2/health"
  handlers ["pagerduty", "slack"]
  subscribers ["api"]
  interval 20
end
Here, the http-check plugin is going to run every 20 seconds on every server with an agent subscription configured. If the check identifies that the web service is not responding, the event and error message are distributed through PagerDuty and Slack.
Example: Module tests as Sensu checks
Writing tests first and then monitoring code next is vital to covering your bases, but it can be a bit cumbersome to keep changes between the two in sync. A better evolution of this sequence is to reduce the duplication between writing good tests and writing Sensu checks to validate live behavior. This is easily resolved by making use of the serverspec plugin, which allows you to take all of your Serverspec tests and reuse them in your monitoring logic. That way, you’re only writing your verification code once, but it’s running in two different contexts: your test environment and your production environment.
Writing this kind of monitoring configuration is incredibly easy:
sensu_check "serverspec" do
  command "check-serverspec.rb -d /etc/sensu/serverspec"
  handlers ["pagerduty", "slack"]
  standalone true
  interval 30
end
You’ll notice that this code is similar to a simple HTTP check. This Sensu check inspects the directory where your Serverspec tests are stored every 30 seconds. All of those tests are then executed; any failures that occur represent legitimate issues on production, and the tests’ error messages are distributed across your notification channels, like PagerDuty or Slack. Even better, if you add new tests to the directory as your application gains new capabilities, they will be picked up automatically.
Monitoring equals testing
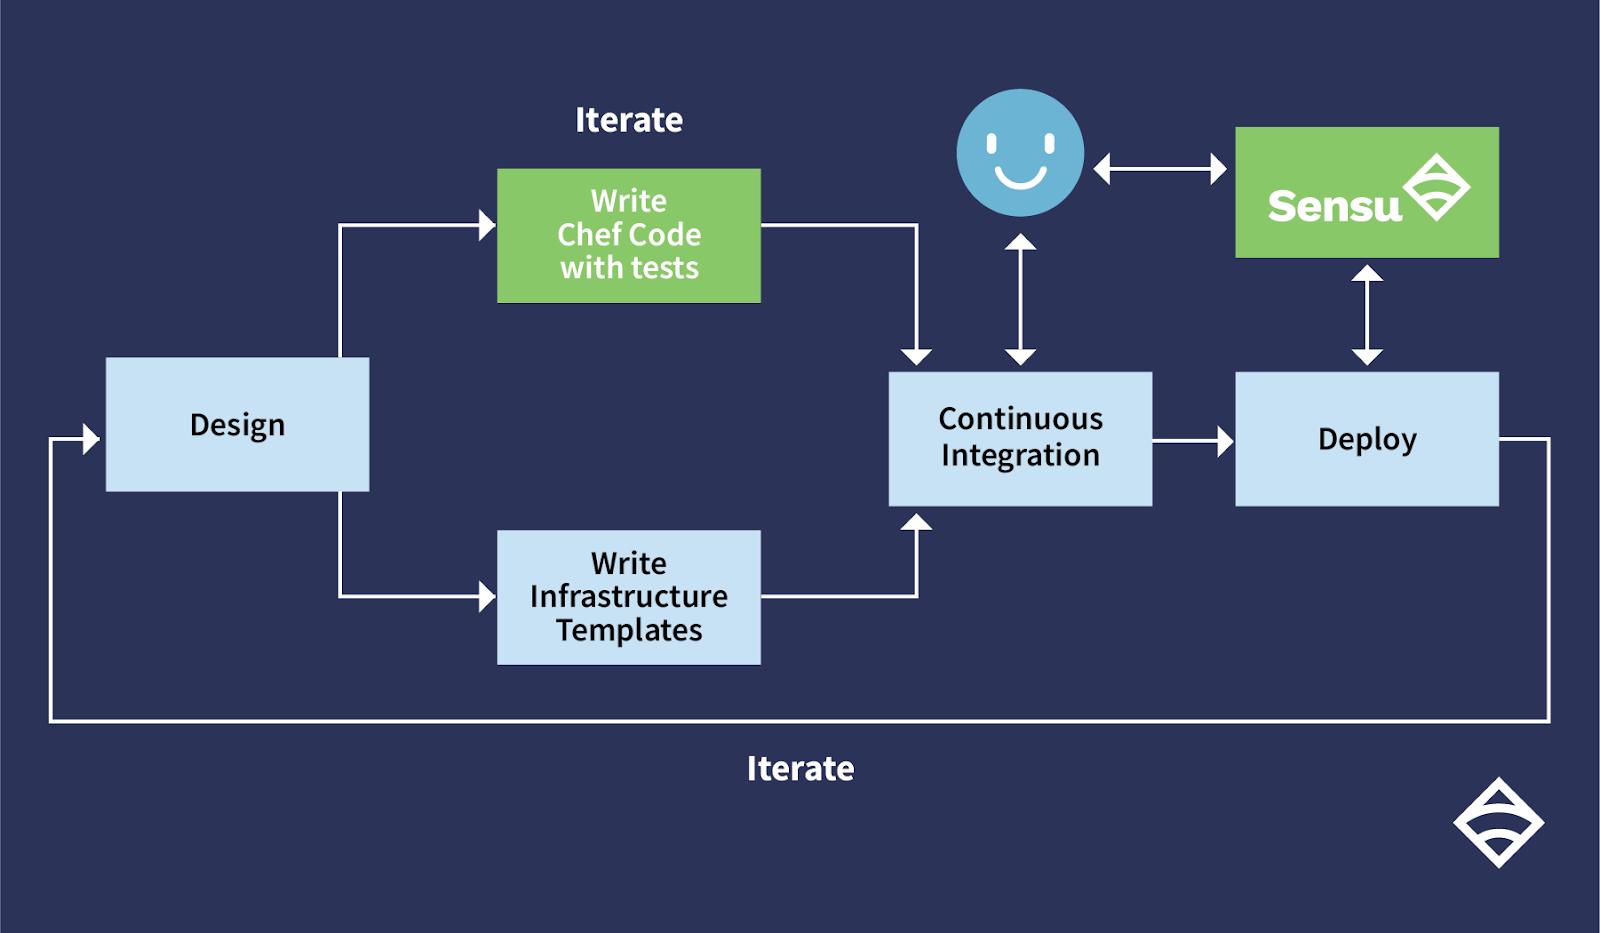
With the inclusion of testing and monitoring, your DevOps workflow now looks something like this:

To summarize:
- Write IaC tests (serverspec, bats, etc.)
- Commit your tests to your IaC software repository (git, etc.)
- CI will run the IaC tests for every future code change (testing)
- All future IaC changes will trigger CI to run the tests
- Leverage the IaC tests for monitoring checks for ongoing testing
You now have two points of feedback: your testing logic, which ensures that your infrastructure code meets your expectations, and your monitoring tool, which picks up that logic and is responsible for validating it on an ongoing basis.
DevOps can help us deliver software faster, but by default, there are inherently no safety guarantees. While we may be content with having just a testing layer in place for spinning up servers, it’s not enough. By incorporating monitoring into your workflow, you can be absolutely certain that we have enough visibility into how your infrastructure operates.

