Adapted from a post in Discourse, the Sensu Community Forum.
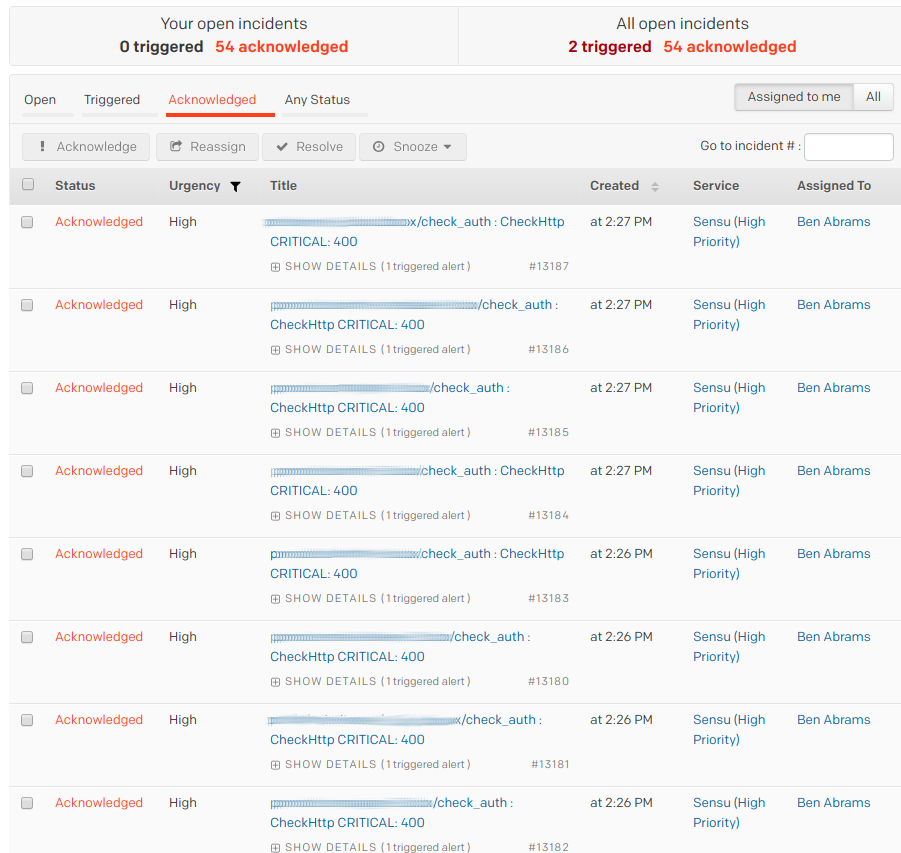
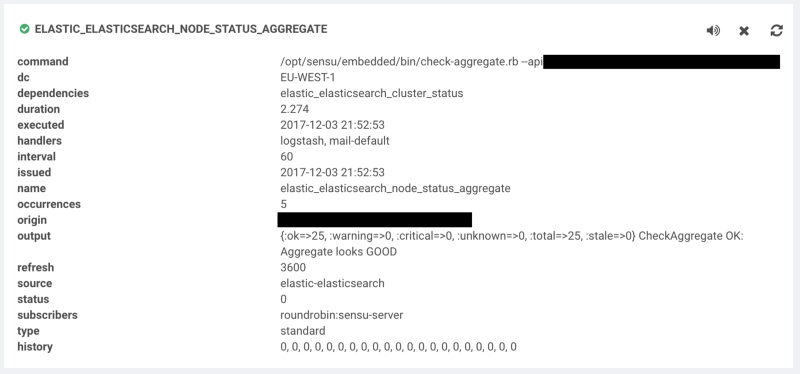
Aggregates, which allow you to monitor groups of checks or entities, were a much-beloved feature in Sensu Core (the predecessor to Sensu Go) — Ben Abrams describes them as “awesome” in his post on alert fatigue, noting that aggregates are like having “a bunch of nodes behind a load balancer where each node is healthchecked, and if a node drops out it may not be worth waking someone up in the middle of the night.” Prior to Ben, Sensu Community member Michael Eves also wrote about aggregates (going back in the archives to December 2017!), detailing how to aggregate the health of all nodes on a system and then decide whether the service is healthy based on a ratio of HTTP check results.
The good news is, the magic of aggregates was not lost when we developed Sensu Go! In Sensu Go, you construct aggregates using labels, which then become part of the event payload generated by an entity or check. This tutorial discusses two different approaches to using aggregates.
The first approach we’ll cover is entity aggregates (e.g., monitoring a group of labeled entities). The second approach we’ll cover is using check aggregates to monitor a group of labeled service checks.
Initial configuration
Before we get started with entity aggregates, we’ll need to do a bit of set configuration. This configuration will allow us to use a separate service account for checking aggregates and will make use of an API key rather than a user/password combination.
For the purposes of this guide, we’ll be using a backend running on CentOS. Let’s start by creating an aggregate-checker user, role, and role-binding:
sensuctl user create aggregate-checker --password='$YOURPASSWORDHERE'
sensuctl role create get-events --verb list,get --resource events
sensuctl role-binding create aggregate-get-events --role=get-events --user=aggregate-checker
Now that we’ve created the aggregate user, role, and role-binding, we’ll create an API key for the aggregate-checker user:
$ sensuctl api-key grant aggregate-checker
Created: /api/core/v2/apikeys/03f66dbf-6fe0-40d4-8174-95b5eab95649
Now that we have our API key, we’ll create an environment variable and associated secret so that we don’t pass the API key in plaintext as part of our checks:
cat << EOF | sensuctl create
---
type: Secret
api_version: secrets/v1
metadata:
  name: sensu-aggregate-api-key
  namespace: default
spec:
  id: SENSU_API_KEY
  provider: env
EOF
NOTE: In order to be able to use secrets, you must have mTLS configured. To learn more about how to set up mTLS, check out our docs.
That takes care of setting up our service account and our API key. Note that if you don’t want to go through the process of creating an API key for your aggregate-checker user, you can still use a username/password approach to authenticate against your Sensu backend’s API. However as a best practice, we recommend that any account accessing the API use an API key.
Let’s move on to creating the checks. We’ll start with entity aggregates.
Entity aggregates
To include an entity in an aggregate, you must assign a label or set of labels to it. For this example, imagine you have 20 web servers serving a number of applications. In this scenario, you might not care if a single web server stops responding, but you would care if 15 of the 20 web servers stop responding.
Add a label in your /etc/sensu/agent.yml:
---
# Sensu agent configuration
##
# agent overview
##
name: "webserver01.example.com"
namespace: "default"
subscriptions:
  - webservers
labels:
  server_role: "webserver"
After you add the label, restart your agent to pick up the change in configuration:
systemctl restart sensu-agent
Next, configure a check that will identify events with the label you assigned to the entity and ensure that these events are in an OK status. Before you write the check, you’ll need to download the aggregate check plugin via sensuctl asset add sensu/sensu-aggregate-check.
After you’ve added the aggregate check plugin asset, you’ll create the check. Here’s an example:
---
api_version: core/v2
type: CheckConfig
metadata:
  namespace: default
  name: webservers-aggregate-check
spec:
  runtime_assets:
  - sensu/sensu-aggregate-check
  command: sensu-aggregate-check --entity-labels='server_role:webserver' --warn-percent=75 --crit-percent=50
  subscriptions:
  - backend
  round_robin: true
  secrets:
  - name: SENSU_API_KEY
    secret: sensu-api-key
  publish: true
  interval: 30
  handlers:
  - slack
  - pagerduty
  - email
The check command uses an API key to access the API and matches events with the label server_role: webserver. The check will create an event if 75% of the aggregate events are in a warning state and if 50% of the aggregate events are in a critical state.
Check aggregates
Checks can also comprise aggregates. To continue the scenario, suppose that your web servers are serving various applications on different ports: 80, 8080, and 9000. A standard check grouping might look like this:
---
type: CheckConfig
metadata:
  name: check-webapp-80
  namespace: default
spec:
  command: "check-http.rb -u http://webserver01.example.com"
  handlers:
  - slack
  high_flap_threshold: 0
  interval: 10
  low_flap_threshold: 0
  publish: true
  runtime_assets:
  - sensu-plugins/sensu-plugins-http
  - sensu/sensu-ruby-runtime
  subscriptions:
  - linux

---
type: CheckConfig
metadata:
  name: check-webapp-8080
  namespace: default
spec:
  command: "check-http.rb -u --port 8080 http://webserver01.example.com"
  handlers:
  - slack
  high_flap_threshold: 0
  interval: 10
  low_flap_threshold: 0
  publish: true
  runtime_assets:
  - sensu-plugins/sensu-plugins-http
  - sensu/sensu-ruby-runtime
  subscriptions:
  - linux

---
type: CheckConfig
metadata:
  name: check-webapp-9000
  namespace: default
spec:
  command: "check-http.rb -u --port 9000 http://webserver01.example.com"
  handlers:
  - slack
  high_flap_threshold: 0
  interval: 10
  low_flap_threshold: 0
  publish: true
  runtime_assets:
  - sensu-plugins/sensu-plugins-http
  - sensu/sensu-ruby-runtime
  subscriptions:
  - linux
Three separate checks are monitoring your web application. However, if you want to view your web app’s health, these three checks don’t do the best job of providing that insight. These checks are isolated from each other, and each check alerts individually.
Instead, it makes more sense to configure this group of checks as an aggregate because you might not care if a check on an individual host fails, but you will certainly care if a large percentage of the checks are in a warning or critical state across a number of hosts.
To turn these checks into an aggregate, add a label to each of them:
---
type: CheckConfig
metadata:
  name: check-webapp-80
  namespace: default
  labels:
    service_type: webapp
spec:
  command: "check-http.rb -u http://webserver01.example.com"
  high_flap_threshold: 0
  interval: 10
  low_flap_threshold: 0
  publish: true
  runtime_assets:
  - sensu-plugins/sensu-plugins-http
  - sensu/sensu-ruby-runtime
  subscriptions:
  - linux

---
type: CheckConfig
metadata:
  name: check-webapp-8080
  namespace: default
  labels:
    service_type: webapp
spec:
  command: "check-http.rb -u --port 8080 http://webserver01.example.com"
  high_flap_threshold: 0
  interval: 10
  low_flap_threshold: 0
  publish: true
  runtime_assets:
  - sensu-plugins/sensu-plugins-http
  - sensu/sensu-ruby-runtime
  subscriptions:
  - linux

---
type: CheckConfig
metadata:
  name: check-webapp-9000
  namespace: default
  labels:
    service_type: webapp
spec:
  command: "check-http.rb -u --port 9000 http://webserver01.example.com"
  high_flap_threshold: 0
  interval: 10
  low_flap_threshold: 0
  publish: true
  runtime_assets:
  - sensu-plugins/sensu-plugins-http
  - sensu/sensu-ruby-runtime
  subscriptions:
  - linux
You can use the label as part of an aggregate that gives you more visibility into the health of your web app. You’ll note that handlers are missing in our check definitions. If you want to alert on an aggregate, it’s often more useful to handle the aggregate instead of handling each individual check.
Now, to check these services as part of a combined aggregate, use a check like this:
---
api_version: core/v2
type: CheckConfig
metadata:
  namespace: default
  name: webapp-aggregate-check
spec:
  runtime_assets:
  - sensu/sensu-aggregate-check
  command: sensu-aggregate-check --check-labels='service_type:webapp' --warn-percent=75 --crit-percent=50
  subscriptions:
  - backend
  round_robin: true
  secrets:
  - name: SENSU_API_KEY
    secret: sensu-api-key
  publish: true
  interval: 30
  handlers:
  - slack
  - pagerduty
  - email
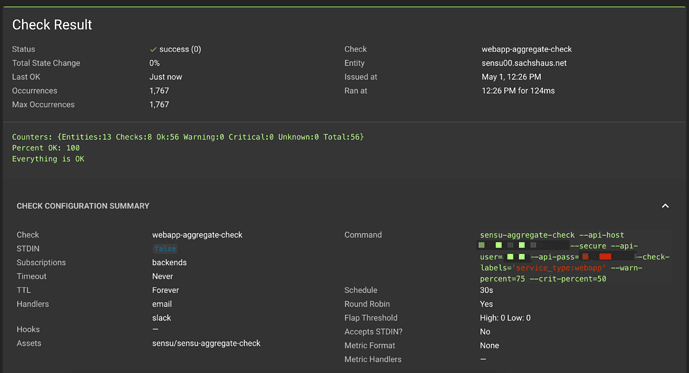
Congratulations! Your aggregate is in place. Here’s how it might look in the Sensu web UI:
Thanks for reading! We hope you found this brief tutorial helpful in terms of how to use aggregates to help you monitor the health of your systems. As always, we invite you to join us on Discourse to share your own solutions, ask questions, and learn from the Sensu Community.

Related Posts
Alert fatigue, part 4: alert consolidation
In part 4 in this series on alert fatigue, Community Maintainer Ben Abrams covers alert consolidation, which helps you cut through the “white noise” and focus on what's important (especially in the middle of a major incident).
Sensu Aggregates
This is a guest post to the Sensu Blog by Michael Eves, member to the Sensu community. He offered to share his experience as a user in his own words, which you can do too by emailing…

Check output metric extraction with InfluxDB & Grafana
With Sensu’s robust event pipeline, you can cater different methods of metric analysis for application performance monitoring, system metrics and telemetry data, & metric aggregation.

Made with #monitoringlove by SensuTM in Canada 🇨🇦 and the USA 🇺🇸. © 2017-2021 – Privacy Statement – Terms & Conditions