This is part 4 in a series on alert fatigue, Check out parts 1, 2, and 3.
So far, we’ve covered alert reduction with Sensu filters and token substitution; automating triage; and remediation with check hooks and handlers (links above). In this post, I’ll cover alert consolidation via round robin subscriptions and JIT/proxy clients; aggregates; and check dependencies. These are all designed to help you cut through the “white noise” and focus on what’s important (especially in the middle of a major incident).
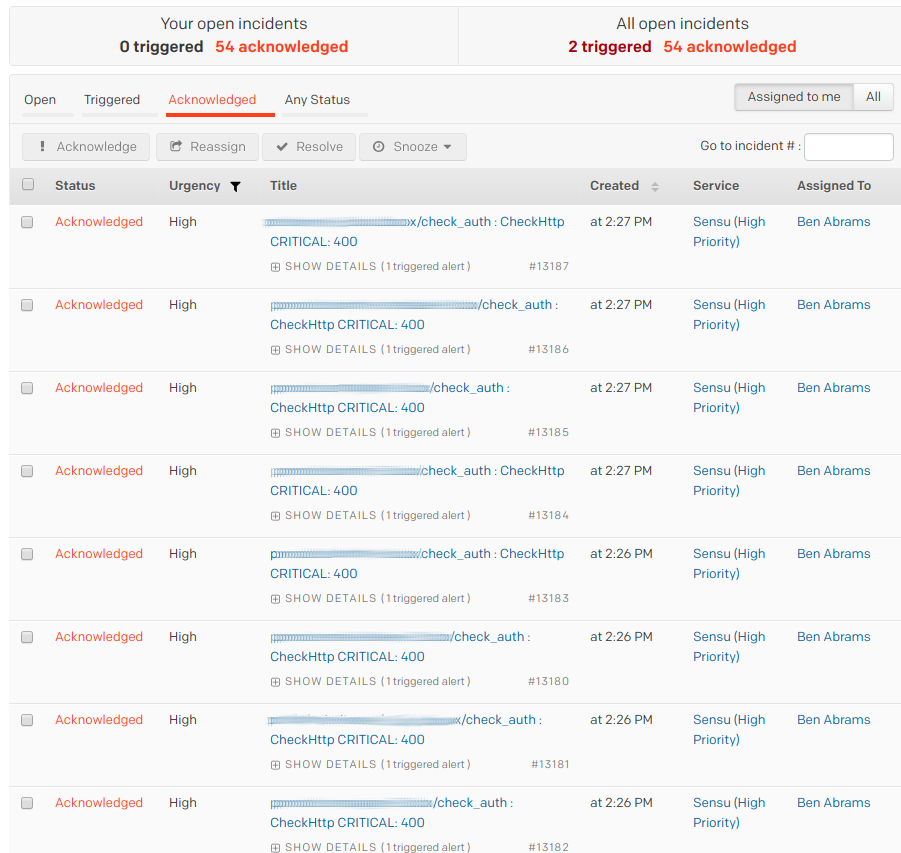
The below screenshot was from my first week on-call at Doximity: we were alerted that our auth service endpoint was failing healthchecks from every single node.

It turned out that this was due to an application deploy that removed a healthcheck that we were apparently not supposed to monitor, which meant there was actually no service disruption. I got 52 of the exact same alert, but we could have taken those alerts and made them only one using a couple of pretty straightforward features in Sensu. There are actually two approaches to take — let’s look at each of them in detail.
Proxy/JIT clients + round robin subscriptions
Proxy (formerly known as “Just In Time”) clients allow you to run the check from one location and create a client for the external service. This is extremely handy for monitoring services where getting an agent in the box is difficult or when checking an external entity.
Round robin subscriptions work very similarly to traditional round robin checking or load balancing. For most use cases, you won’t notice that it’s not true round robin, but you may notice it seems to favor one node over another. You’re not crazy (at least I should say this does not confirm nor deny your craziness); what happens is that Sensu fires an event and drops it into RabbitMQ. Any nodes that match the subscription can pull it, and it’s first come first serve. In a setup where you have equal hardware profiles, local network, etc., you will not notice the nuance, but if you’re round robining from two nodes across a WAN, the one that has better throughput and latency will likely end up “winning” it more often than the other.
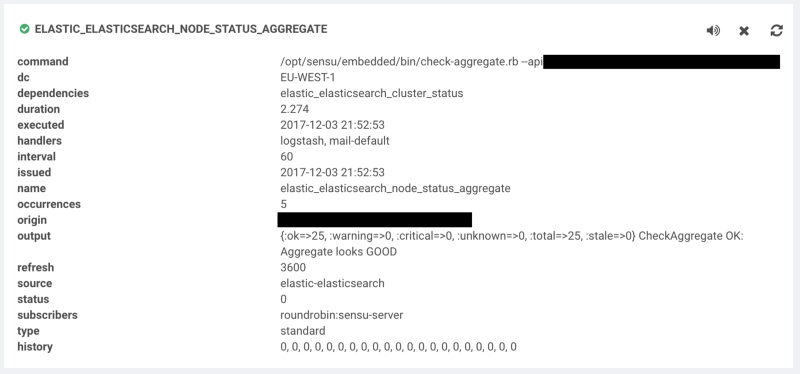
For example, we’re monitoring an Elasticsearch 5 cluster status. As this is something achieved via quorum and a remote API, checking from every single instance in the cluster will yield the same results. This is similar to the auth situation I mentioned a few paragraphs ago. By combining a proxy check with a round robin subscription, we can allow the check to be executed one at a time from any of the nodes but report it as a single client, so our number of alerts go from n nodes to a single alert.
Here’s an example:
{
  "checks": {
    "check_es5_cluster": {
      "command": "check-es-cluster-status.rb -h :::address:::",
      "subscribers": ["roundrobin:es5"],
      "interval": 30,
      "source": ":::es5.cluster.name:::",
      "ttl": 120
    }
  }
}
By simply adding roundrobin:es5, we’re telling this check to be scheduled on any node with the subscription of es5. The source attribute tells us the name of the client it will create in Sensu, which can be alerted on separately from the node that executed the check. As we had multiple Elasticsearch5 clusters (logging and application), we used a token substitution to set the name to the cluster name. An important thing to keep in mind with proxy checks is that since there is no agent running, you don’t get a free keepalive check, so we use the ttl option to tell us to alert if no client has published its results in the last two minutes.
We just need the matching subscription in our client.json:
{
  "client": {
    "name": "i-424242",
    "address": "10.10.10.10",
    "subscriptions": ["base", "roundrobin:es5"],
    "safe_mode": true
  }
}
Aggregates

Honestly, aggregates are awesome. I tend to think of them in terms of having a bunch of nodes behind a load balancer where each node is healthchecked, and if a node drops out it may not be worth waking someone up in the middle of the night. Because Mike Eves did a fantastic job going into a lot of detail in his post (you should check it out), I’m going to keep it brief.
Similar to the remediator solution, this requires a couple of components.
We start with defining a check (much like many others) and add the aggregates key. See the below example:
{
  "checks": {
    "sensu_rabbitmq_amqp_alive": {
      "command": "check-rabbitmq-amqp-alive.rb",
      "subscribers": ["sensu_rabbitmq"],
      "interval": 60,
      "ttl": 180,
      "aggregates": ["sensu_rabbitmq"],
      "handle": false
    }
  }
}
The aggregates key tells Sensu to create a namespace called sensu_rabbitmq which we’ll use to query later. Each machine in the sensu_rabbitmq subscription will run the check and push their results under this namespace.
Next, we define a check to query the results in the namespace, as in the following example:
{
  "checks": {
    "sensu_rabbitmq_amqp_alive_aggregate": {
      "command": "check-aggregate.rb --check sensu_rabbitmq_amqp_alive --critical_count 2 --age 180",
      "aggregate": "sensu_rabbitmq",
      "source": "sensu-rabbitmq",
      "hooks": {
        "critical": {
          "command": "curl -s -S localhost:4567/aggregates/sensu_rabbitmq/results/critical | jq .[].check --raw-output",
        }
      }
    }
  }
}
We’re checking that at least two or more nodes are in a critical state before alerting. As we lose the context in this aggregate query, let’s leverage the check hook and the Sensu aggregates API to add the critical results to the event. This check comes from the same sensu-plugins-sensu gem as the remediator.
Check dependencies
The last technique I want to talk about solves a different pattern of problems than the previous ones; we’ll focus on getting the most relevant alert to the responder so they can focus on root causes, rather than symptoms.
Check dependencies are facilitated by a Sensu Core filter extension, located here. They allow you to prevent mutators and handlers from acting on events if their dependencies fail. You can use specific checks or even whole subscriptions.
Here’s an example of a check depending on another check:
{
  "checks": {
    "check_foo_open_files": {
      "command": "check-open-files.rb -u foo -p foo -w 80 -c 90",
      "subscribers": ["foo_service"],
      "handlers": ["pagerduty"],
      "dependencies": ["client:CLIENT_NAME/check_foo_process"]
    }
  }
}
In this example, we’re monitoring the foo process for number of open file descriptors in use, as this process has a habit of having leaks. We can’t check how many files it has open if the process is not currently running, so we create a relation with the dependencies key. In this case — since the relation is local — we use the same syntax as previously used with the remediator handler. If you had a web service that depended on a database service, you could use the appropriate subscription removing the client:CLIENT from the object.
Reducing alert fatigue is never totally done. Coming up in the fifth part of this series, I’ll go into further detail on how to fine tune Sensu, with features such as silencing, flap detection, and safe mode.


