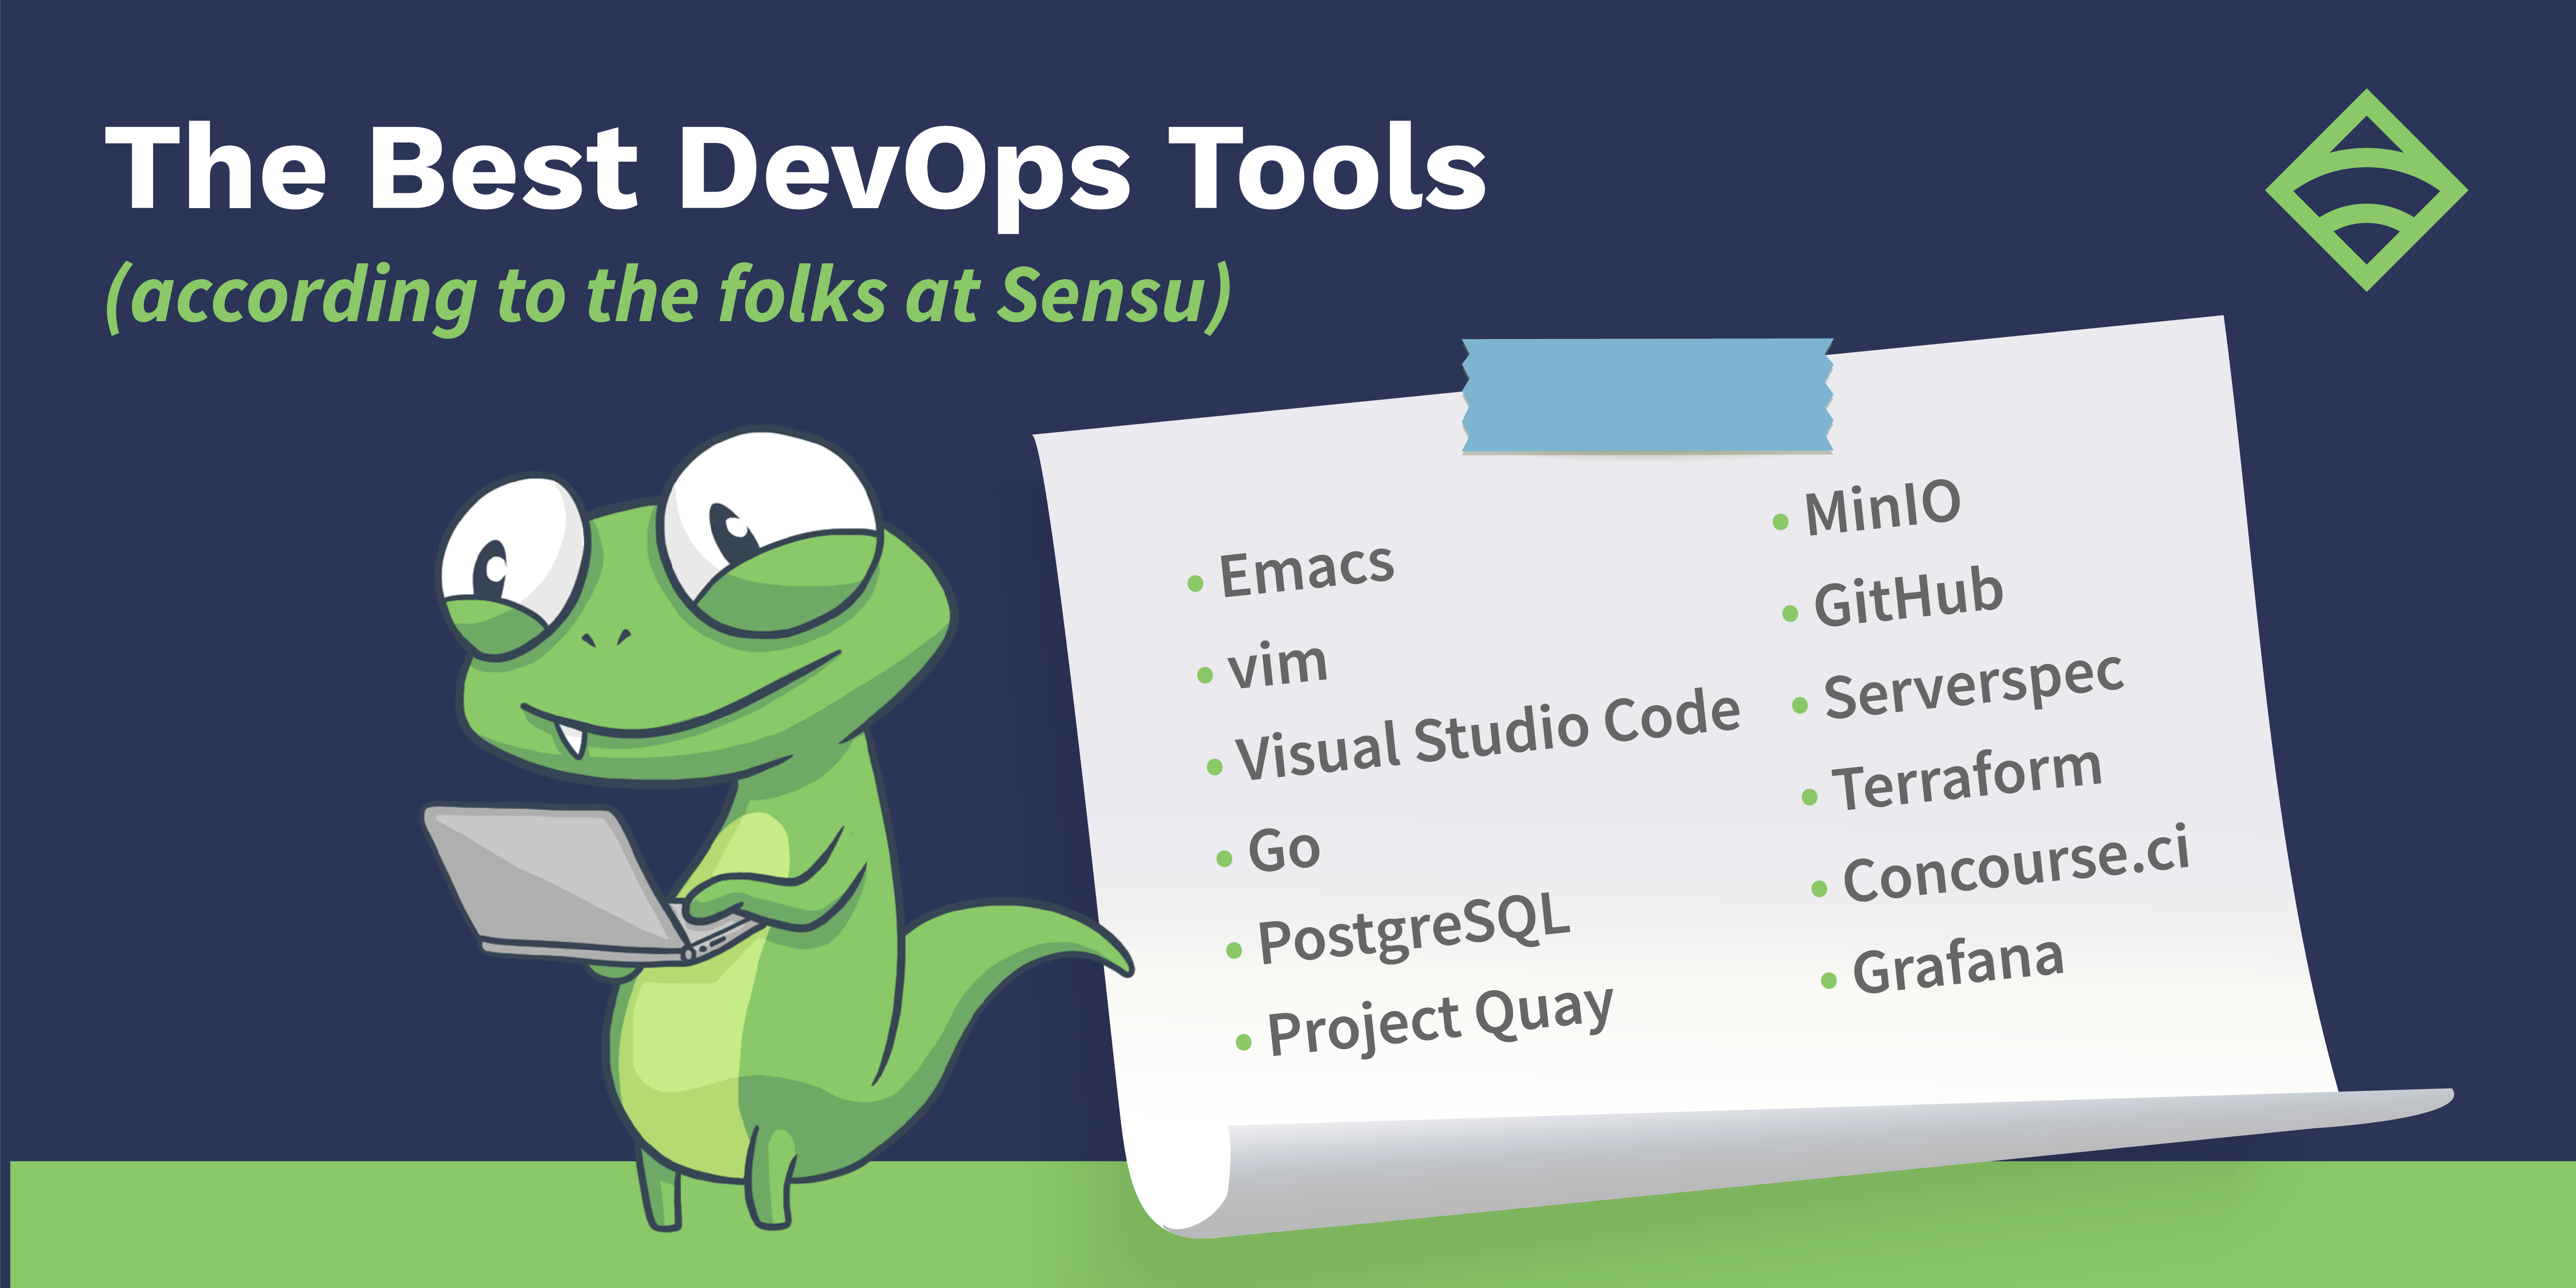
DevOps has been a hot topic for many years, but it’s still common for organizations to feel overwhelmed by the complexity of automating their entire infrastructure and to get hung up on which tools to use.
An integrated set of DevOps tools for monitoring has the power to improve visibility and productivity, achieve higher-performing systems, and establish cross-functional collaboration. The right toolset is more than the tools themselves — it’s about developing the culture, discipline, and practices that come to define your product/service and your workplace.
 Photo by Barn Images on Unsplash
In this post, we’ll outline our favorite DevOps tools for the monitoring ecosystem that help dev and ops teams work together effectively.
Monitoring tools
What: It should come as no surprise that we’re starting our discussion of DevOps tools with a focus on the set we know best: monitoring tools. A good monitoring platform lets you monitor infrastructure and application performance, whether on-prem, in the cloud, or across containerized environments — so you have complete visibility into every system, all the time.
Whether you want to monitor Kubernetes, IoT devices, or bare metal, the right monitoring tool helps make it possible.
Benefits: An effective monitoring tool improves system performance and productivity, and helps you reduce (or even eliminate) downtime. You can adequately plan for upgrades and new projects, and better allocate your time and resources. You can detect problems — and solve them — before they impact users.
Tools:
- Sensu - A flexible and scalable telemetry and service health checking solution for monitoring servers, containers, services, applications, functions, & connected devices.
- Prometheus - Relies on the pull method to collect information, with a built-in database.
- Nagios - The legacy monitoring tool that introduced monitoring practices to a generation of operators.
Resources:
- The tl;dr on Nagios service checks, and how to reuse them in Sensu
- The pros and cons of Prometheus for monitoring Kubernetes
- [How to] Automate your monitoring workflow
Configuration management tools
What: Configuration management tools allow you to automate the provisioning and deployment of systems, enforce desired configurations, and remediate configuration drift. By modeling your infrastructure as code, you can apply software delivery practices like version control, automated testing, and continuous delivery to infrastructure and applications.
Benefits: Automating work that used to be manual, repetitive, and error-prone results in greater speed, predictability, and scalability — and the assurance of standardized configurations across test, dev, and production environments. Eliminating snowflake servers reduces time (and headaches) and lets you deploy software faster and more reliably.
Tools:
- Ansible - Written in Python, agent-less, utilizes an imperative (rather than declarative) approach.
- Chef - Written in Ruby, also relies on an imperative config management approach.
- Puppet - Relies on a declarative config management approach, using a domain-specific language and an agent/master architecture.
Resources:
- An introduction to using Chef to automate infrastructure management
- Applying the principles of infrastructure as code to testing and monitoring
Alerting tools
What: Alerting tools provide both actionable and informational system alerts, and can be customized to fit the complexities of your systems. For example, your alerting system needs to be sensitive enough to cover an outage — but not so sensitive that you’re catching frequent, intermittent problems that A) users aren’t going to see and B) inundate you with needless alerts.
Benefits: Alerting tools help lay the foundation for your alerting policies, so you can determine who to notify, how to track issues and outcomes, and how to prioritize remediation.
Tools:
- PagerDuty - On-call management platform with add-ons for analytics, event intelligence, and automated incident response.
- ServiceNow - Utilizes automated workflows for ITSM, as well as customer service and business processes.
- Slack - Lets you consolidate alerts into the same platform you use for group chats and collaboration.
Resources:
- [How to] Send alerts to Slack with Sensu handlers
- [How to] Use Sensu filters to reduce alert fatigue
- A guide to alleviate + mitigate alert fatigue (written by a Sensu Community maintainer)
Metrics storage
What: Once you’ve automated configuration management, alerting, and monitoring, you’ll have a whole lot of data at your disposal to learn from. The challenge: How do you securely store and analyze it? You need a storage system that lets you aggregate and learn from system capacity, user behavior, service levels, security risks, and more.
Benefits: The insights you gain from your metrics inform decisions across all layers of your business, improving your ability to meet SLAs, satisfy customer expectations, and make the case for new strategic investments. Data-driven decisions promote a culture of continuous learning and improvement.
Tools:
- InfluxDB - Time-series database that’s suited for long-term data storage.
- Splunk - Uses a search engine database model to store and query data.
- AWS - Supports a wide range of storage purposes, including relational and non-relational databases, a data warehouse for analytics, a time-series database, a ledger database to store transactions, and more.
Resources:
Visualization tools
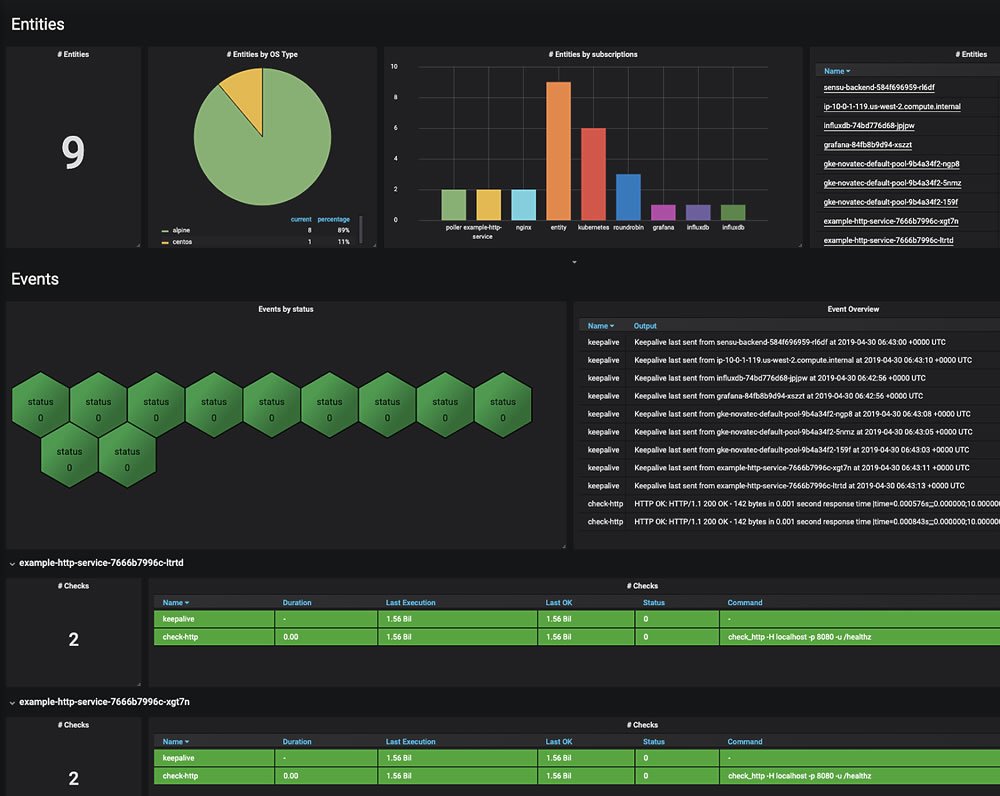
What: A visualization tool might be considered the pièce de résistance of your DevOps toolchain for monitoring: you get to combine all of your data, sort and visualize it, and display it on customizable dashboards.
Benefits: Visualization tools provide context and meaning, allow you to track changes and improvements over time, and give management a real-time view that helps guide strategic decisions. Customization options make it easy for team members to design and share their own dashboards.
Tools:
- Grafana - Can be used on top of a variety of different data stores, including Graphite, InfluxDB, and Elasticsearch.
Resources:
- A use case for combining Sensu, InfluxDB, and Grafana
- [How to] Visualize metrics with Grafana
Next steps: evaluating your DevOps tools
No matter where you are in your DevOps journey, it’s wise to re-evaluate the tools you’re using and identify where you can fine tune. Think about the DevOps tools in the monitoring ecosystem as more than their capabilities; how you use them begins to define your habits, values, and work culture — and accordingly, the quality of your product or service and the value you bring to your users.
To learn more about how DevOps tools work together — and their place within the monitoring ecosystem — be sure to visit Bonsai, the Sensu asset index, where you can search and discover monitoring use cases as well as many of the above-mentioned solutions and integrations.


