Elasticsearch is a great platform for any data lake initiative, and ideal for analyzing your monitoring and observability data. But if you’re working with a number of different monitoring and observability tools, especially across multiple cloud environments, you might find it challenging to get all your data into Elasticsearch.
The Sensu handler for Elasticsearch allows you to integrate Sensu’s observability pipeline with native Elasticsearch instrumentation for monitoring and metrics collection. There are lots of benefits you can get from the integration, which I’ll describe below. I’m also including demos from the recent webinar I did with Sensu CEO Caleb Hailey about using Sensu and Elasticsearch together for comprehensive observability.
First we’ll discuss the concept of a data lake — what it is, what it isn’t, and what benefits your company can expect from its data lake initiative, whether you have one underway now or you’re still in the discussion stages.
If your company isn’t currently considering a data lake but you want to know how to get more insights from using Elasticsearch and Sensu together, jump to the section below: “The benefits of using Elasticsearch and Sensu together.”
What is a data lake?
A data lake is an organizational initiative. It’s not an actual thing, but the decision to standardize on a central repository. You don’t have a data lake because you’ve decided to send all your data to Elasticsearch — it’s the fact that you’ve decided, as an organization, to send all your data to a central repository.
There’s an important distinction to be made between a data lake and a data warehouse. A data warehouse is a data platform with a consistent data structure or schema that’s defined from the outset. But a data lake might not curate your data in some type of advanced storage; it could be just raw data. It could be relational or non-relational data. And the schema for that data is defined at the point when you analyze it.
What are the benefits of a data lake?
The big benefit of a data lake is that disparate types of data can be stored and then analyzed much more flexibly. A data warehouse, on the other hand, tends to be more restrictive in terms of how you can imagine and design your data.
A data lake offers clear benefits to your business. You can perform all kinds of analysis on your data, such as SQL queries, discovery analytics, full text search, real-time analytics, as well as machine learning or artificial intelligence. You can combine business analytics with backend analytics to come up with new insights that have real strategic value. In fact, research has shown that organizations that successfully generate business value from their data outperform their peers.
We particularly like this pithy quote from Amazon Web Services about the value of a data lake:
“The ability to harness more data, from more sources, in less time, and empowering users to collaborate and analyze data in different ways, leads to better, faster decision making.”
There are three popular use cases for data lakes: improving customer interactions, improving R&D decision making, and increasing operational efficiencies. All of these depend on being able to analyze diverse types of data together and mine correlations for greater insight. In the demos below, we’ll share an example of using Sensu event data to uncover an issue that could have an impact on customer experience.
Data lakes and the role of the IT team
High-performing IT operations teams are always looking for ways to improve the overall business. For these teams, monitoring and observability data isn’t just about keeping the lights on; this data is a critical asset that can be used to improve the business.
By giving priority to analyzing monitoring and observability data alongside other business metrics, IT operations can help the business make better decisions about which improvements will have the greatest impact on the business. When a service or a database is performing poorly or producing inconsistent results, business-oriented IT teams don’t just fix the problem to get the ticket out of the queue; they correlate the data with other business metrics to understand how the issue is contributing to customer churn or other deficiencies in business operations.
Last but not least, there’s no business in the world that doesn’t want to save money while continuing to improve their products and services. Monitoring and observability data can make a huge impact here too, if properly correlated against other business metrics.
Biggest challenges to data lake initiatives
During our webinar about Sensu’s Elasticsearch handler, we asked participants about their biggest challenges to implementing data lake initiatives. No surprise to us, the common answers were:
- Lack of integrations. People struggle to get data into the data lake platform.
- Access governance. It’s hard to control who can write data into the platform.
- Validation of data. More oversight is needed.
- Data is inconsistent. This makes it difficult to catalog your data.
The benefits of using Elasticsearch and Sensu together
Used together, Elasticsearch and Sensu can help you achieve your data lake initiative by delivering a number of improvements, including:
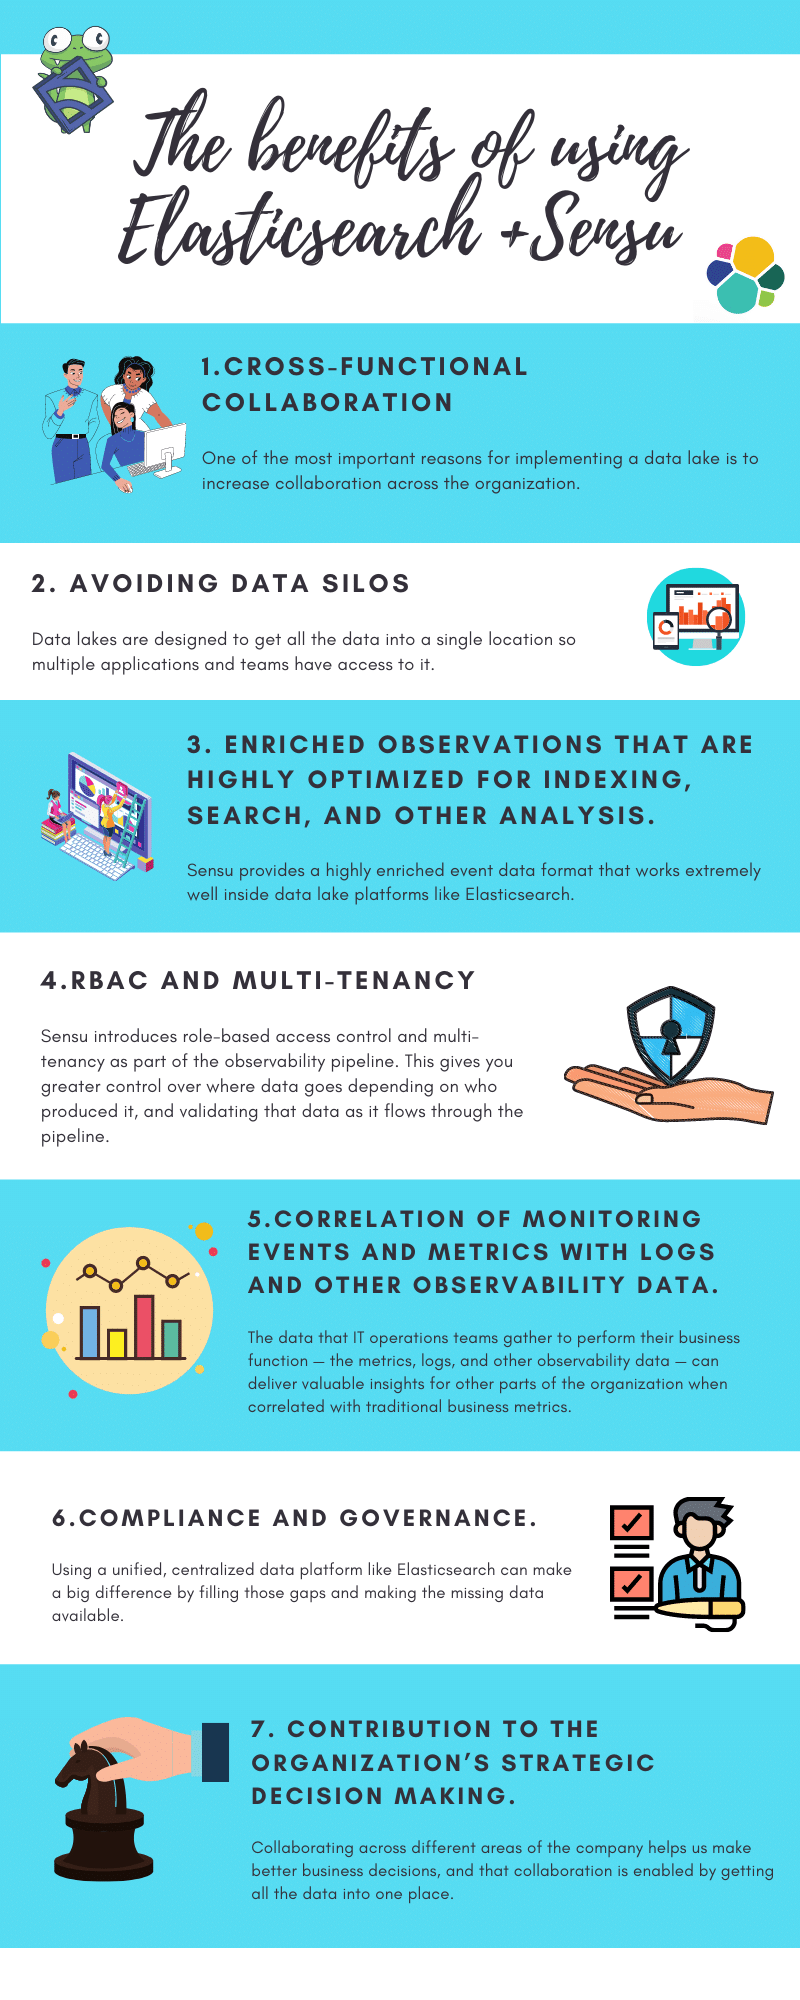
- Cross-functional collaboration. One of the most important reasons for implementing a data lake is to increase collaboration across the organization. Every team has data that’s valuable for performing its own business function. When we put all that data together, it allows us to learn from each other and help achieve business goals.
- Avoiding data silos. Data silos are always a challenge for a business. It’s difficult to extract insights from data when it’s in too many different places (and especially so if there’s a lack of visibility in those places). The whole point of a data lake is to get all the data into a single location so multiple applications and teams have access to it. The central location also facilitates the “single pane of glass” that’s such an elusive yet desirable state for integrating information from many areas of the business, giving stakeholders a single place to get information.
- Enriched observations that are highly optimized for indexing, search, and other analysis. When working with data lake platforms like Elasticsearch, you need context and information so you can categorize data as you search it. Sensu provides a highly enriched event data format that works extremely well inside data lake platforms like Elasticsearch.
- RBAC and multi-tenancy. Sensu introduces role-based access control and multi-tenancy as part of the observability pipeline. This gives you greater control over where data goes depending on who produced it, and validating that data as it flows through the pipeline.
The business benefits of using Sensu and Elasticsearch together include:
- Correlation of monitoring events and metrics with logs and other observability data. The data that IT operations teams gather to perform their business function — the metrics, logs, and other observability data — can deliver valuable insights for other parts of the organization when correlated with traditional business metrics.
- Compliance and governance. When organizations put governance procedures into place, it’s common to discover gaps in the data that are used to guarantee or prove governance policies are being carried out. Using a unified, centralized data platform like Elasticsearch can make a big difference by filling those gaps and making the missing data available.
- Contribution to the organization’s strategic decision making. Collaborating across different areas of the company helps us make better business decisions, and that collaboration is enabled by getting all the data into one place.
Using Sensu and Elasticsearch together: a practical example
Once you’ve put all your data into a data lake, you can go fishing for failures and uncover important ways to improve your business. Visualizing the data also helps a lot.
What’s nice is that you can reuse some of your existing fields in Sensu Go for doing data analysis and writing queries, whether in SQL or something else. You can also make your telemetry much easier to explore with ad hoc custom graphs using your existing tools — for example, Kibana or Grafana.
In the following example, we’ll demonstrate how to uncover a pattern of failures in a web property, looking at an HTTP request duration for two websites. The line graph below shows a view of response times pulled from Sensu events data, pulled graph directly from Elasticsearch, using Kibana. The Y-axis shows an average of total request duration. The X-axis is a date histogram based on the timestamp of each event from Sensu.
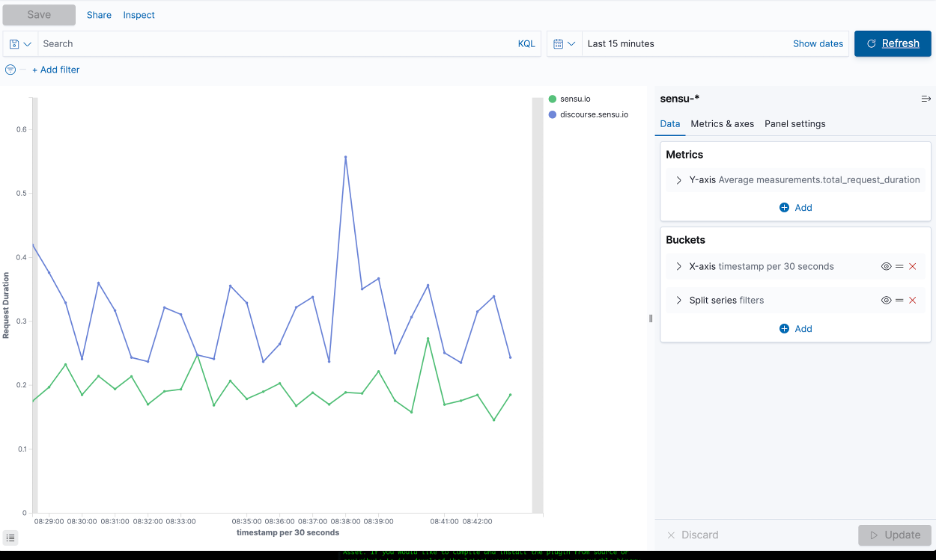
As you’ll see in the demo below, I filter the data based on labels in our event data and split it. Each check has a label indicating the site that was checked. We have a label for sensu.io and a label for discourse.sensu.io.
As noted earlier, one of the powerful things about using Elasticsearch and Sensu together is the ability to correlate monitoring events and metrics with logs and other observability data to come up with insights that matter to the business.
To continue with our example, say we’re seeing sporadic availability of one of our websites. I’d use a label selector to reveal there’s a failure for our web app — just one failure for the specific time period I’m looking at. By looking at Elasticsearch as well, I can now start fishing for more data.
I start with check state: "failing". This command turns up some more failures. I run the check metadata command to make sure that the labels and site for these failures indicate the web app. I can also check that the entity I’m looking at is our production environment.
Next I drill down into the time period where I see the failures. I can see that the web app is running on NGINX web servers, so I run a log file path query of the NGINX logs. I can see that the shutting down message appears consistently during the time period; that tells me something is shutting down our NGINX instances. I can also see the failure is intermittent — somehow, NGINX is starting back up again.
We have Rundeck running, which leads me to believe it’s doing a remediation, recycling NGINX. Sure enough, drilling down shows that, correlated with the ups and downs of our web app, a restart nginx job is running, restarting these failures. I could speculate that possibly a misconfigured NGINX instance has been causing this, but at least I can see clearly that NGINX has been shutting down and then keeps getting restarted by Rundeck — useful information, all correlated into one place, that I can work with further.
The cool thing here is that we already have other data going into Elasticsearch from Rundeck and NGINX. We can complement that data with monitoring metrics that we’re sending to Elasticsearch from Sensu. It’s a great example of going fishing, exploring the data easily.
If you want, you can use Kibana to visualize the data instead of just going through the Discover view. The demo below shows you how this works.
First I add a line graph from the Sensu data. Then I add a filter, check.metadata.labels, and then the site we were looking at, webapp. I add a filter for entity.metadata.labels.environment and then make sure I’m looking at the right environment, production. I ask for a count, and then a date.histogram, using the timestamp from the event.
Next I add a split to aggregate on an event; as before, it’s check.state: "failing". Then I update, and we get a sawtooth graph (as seen at 23:06 in the demo above).
Then I specify the prior 30 minutes, and the visualization I get shows the pattern clearly: NGINX fails, gets restarted, and this happens over and over again (23:16 in the demo).
If you’ve read this far, you’ll want to try this out for yourself. Get started with the Sensu Elasticsearch handler by using sensuctl create -f, which creates an example configuration. You can find the full instructions in our community templates repo.
As always, we want to hear about your experience. Please drop your feedback and questions into this thread on Discourse:

Thanks for sticking with us, and may all your fishing expeditions be productive ones.
Related Posts

Filling gaps in Kubernetes observability with the Sensu Kubernetes Events integration
Learn more about the Kubernetes Observability Events API - why it matters and how it can add context for your observability strategy.

How to publish an asset with the Sensu Go SDK
Learn how to publish an asset using the Sensu Go SDK and package compiled binary plugins (including dynamically linked libraries) as assets.

Made with #monitoringlove by SensuTM in Canada 🇨🇦 and the USA 🇺🇸. © 2017-2021 – Privacy Statement – Terms & Conditions