Your registration has been confirmed. Thank you for signing up!
Consolidate monitoring tools & eliminate observability data silos with Sensu’s unified observability data collection and open integration marketplace.
$ sensuctl create -r -f monitoring/
check "node-exporter" created
check "tls-cert" created
asset "sensu-plugins/sensu-plugins-ssl:1.0.0" created
filter "oncall" created
handler "slack" created
handler "ansible-tower" created
$ sensuctl create -r -f monitoring/
check "node-exporter" created
check "tls-cert" created
asset "sensu-plugins/sensu-plugins-ssl:1.0.0" created
filter "oncall" created
handler "slack" created
handler "ansible-tower" created
$ sensuctl create -r -f monitoring/
check "node-exporter" created
check "tls-cert" created
asset "sensu-plugins/sensu-plugins-ssl:1.0.0" created
filter "oncall" created
handler "slack" created
handler "ansible-tower" created
C:\> sensuctl create -r -f monitoring/
check "node-exporter" created
check "tls-cert" created
asset "sensu-plugins/sensu-plugins-ssl:1.0.0" created
filter "oncall" created
handler "slack" created
handler "ansible-tower" created


The shift from static to dynamic infrastructure requires a change in approach to monitoring, from host-based to functional role-based. Connectivity moves from remote polling to publish-subscribe, the control plane moves from point-and-click interfaces to infrastructure as code workflows and self-service developer APIs.
With Sensu Go, you can fill gaps in observability between metrics, logging, & tracing. Consolidate existing monitoring tools, including Nagios, StatsD, Telegraf, Prometheus, & more.
Sensu Go codifies monitoring workflows into declarative configuration files that can be shared amongst team members, treated as code, edited, reviewed, and versioned.
Embrace auto-scaling with confidence & real-time visibility. Sensu automates the registration and de-registration of servers, containers, services, apps, functions, and connected devices.
Use the right tool for the right job. With Sensu, you can use the right interface and the right data format for each individual problem, configuring the corresponding workflow accordingly. Declarative configurations and a service-based approach to monitoring let you define the monitoring insights that matter most, automating your workflows so you can focus on what matters.
Comprehensive system and service health monitoring. Execute custom scripts, including Nagios-style plugins. Collect basic system metrics, including CPU, memory, and disk usage. Collect custom application metrics and integrate with external databases for unified business intelligence. Collect logs and send them to the database of your choosing.
Send alerts via email, Slack, SMS, and more. Create and resolve incidents in PagerDuty, ServiceNow, and JIRA. Eliminate alert fatigue with built-in de-duplication. Customize alert policies with event filters and contact routing.
Auto-scale with confidence and real-time visibility. Sensu agents automatically discover and register VMs, public cloud compute instances, containers, and the services running on them. Plus, you won’t get alerts for stuff that no longer exists.
Native support for self-healing — use Sensu to trigger service restarts or execute custom scripts when problems are detected. Request Ansible jobs via the Ansible Tower integration. Trigger remediation actions via third-party APIs. Automate repetitive operations by configuring custom workflows.
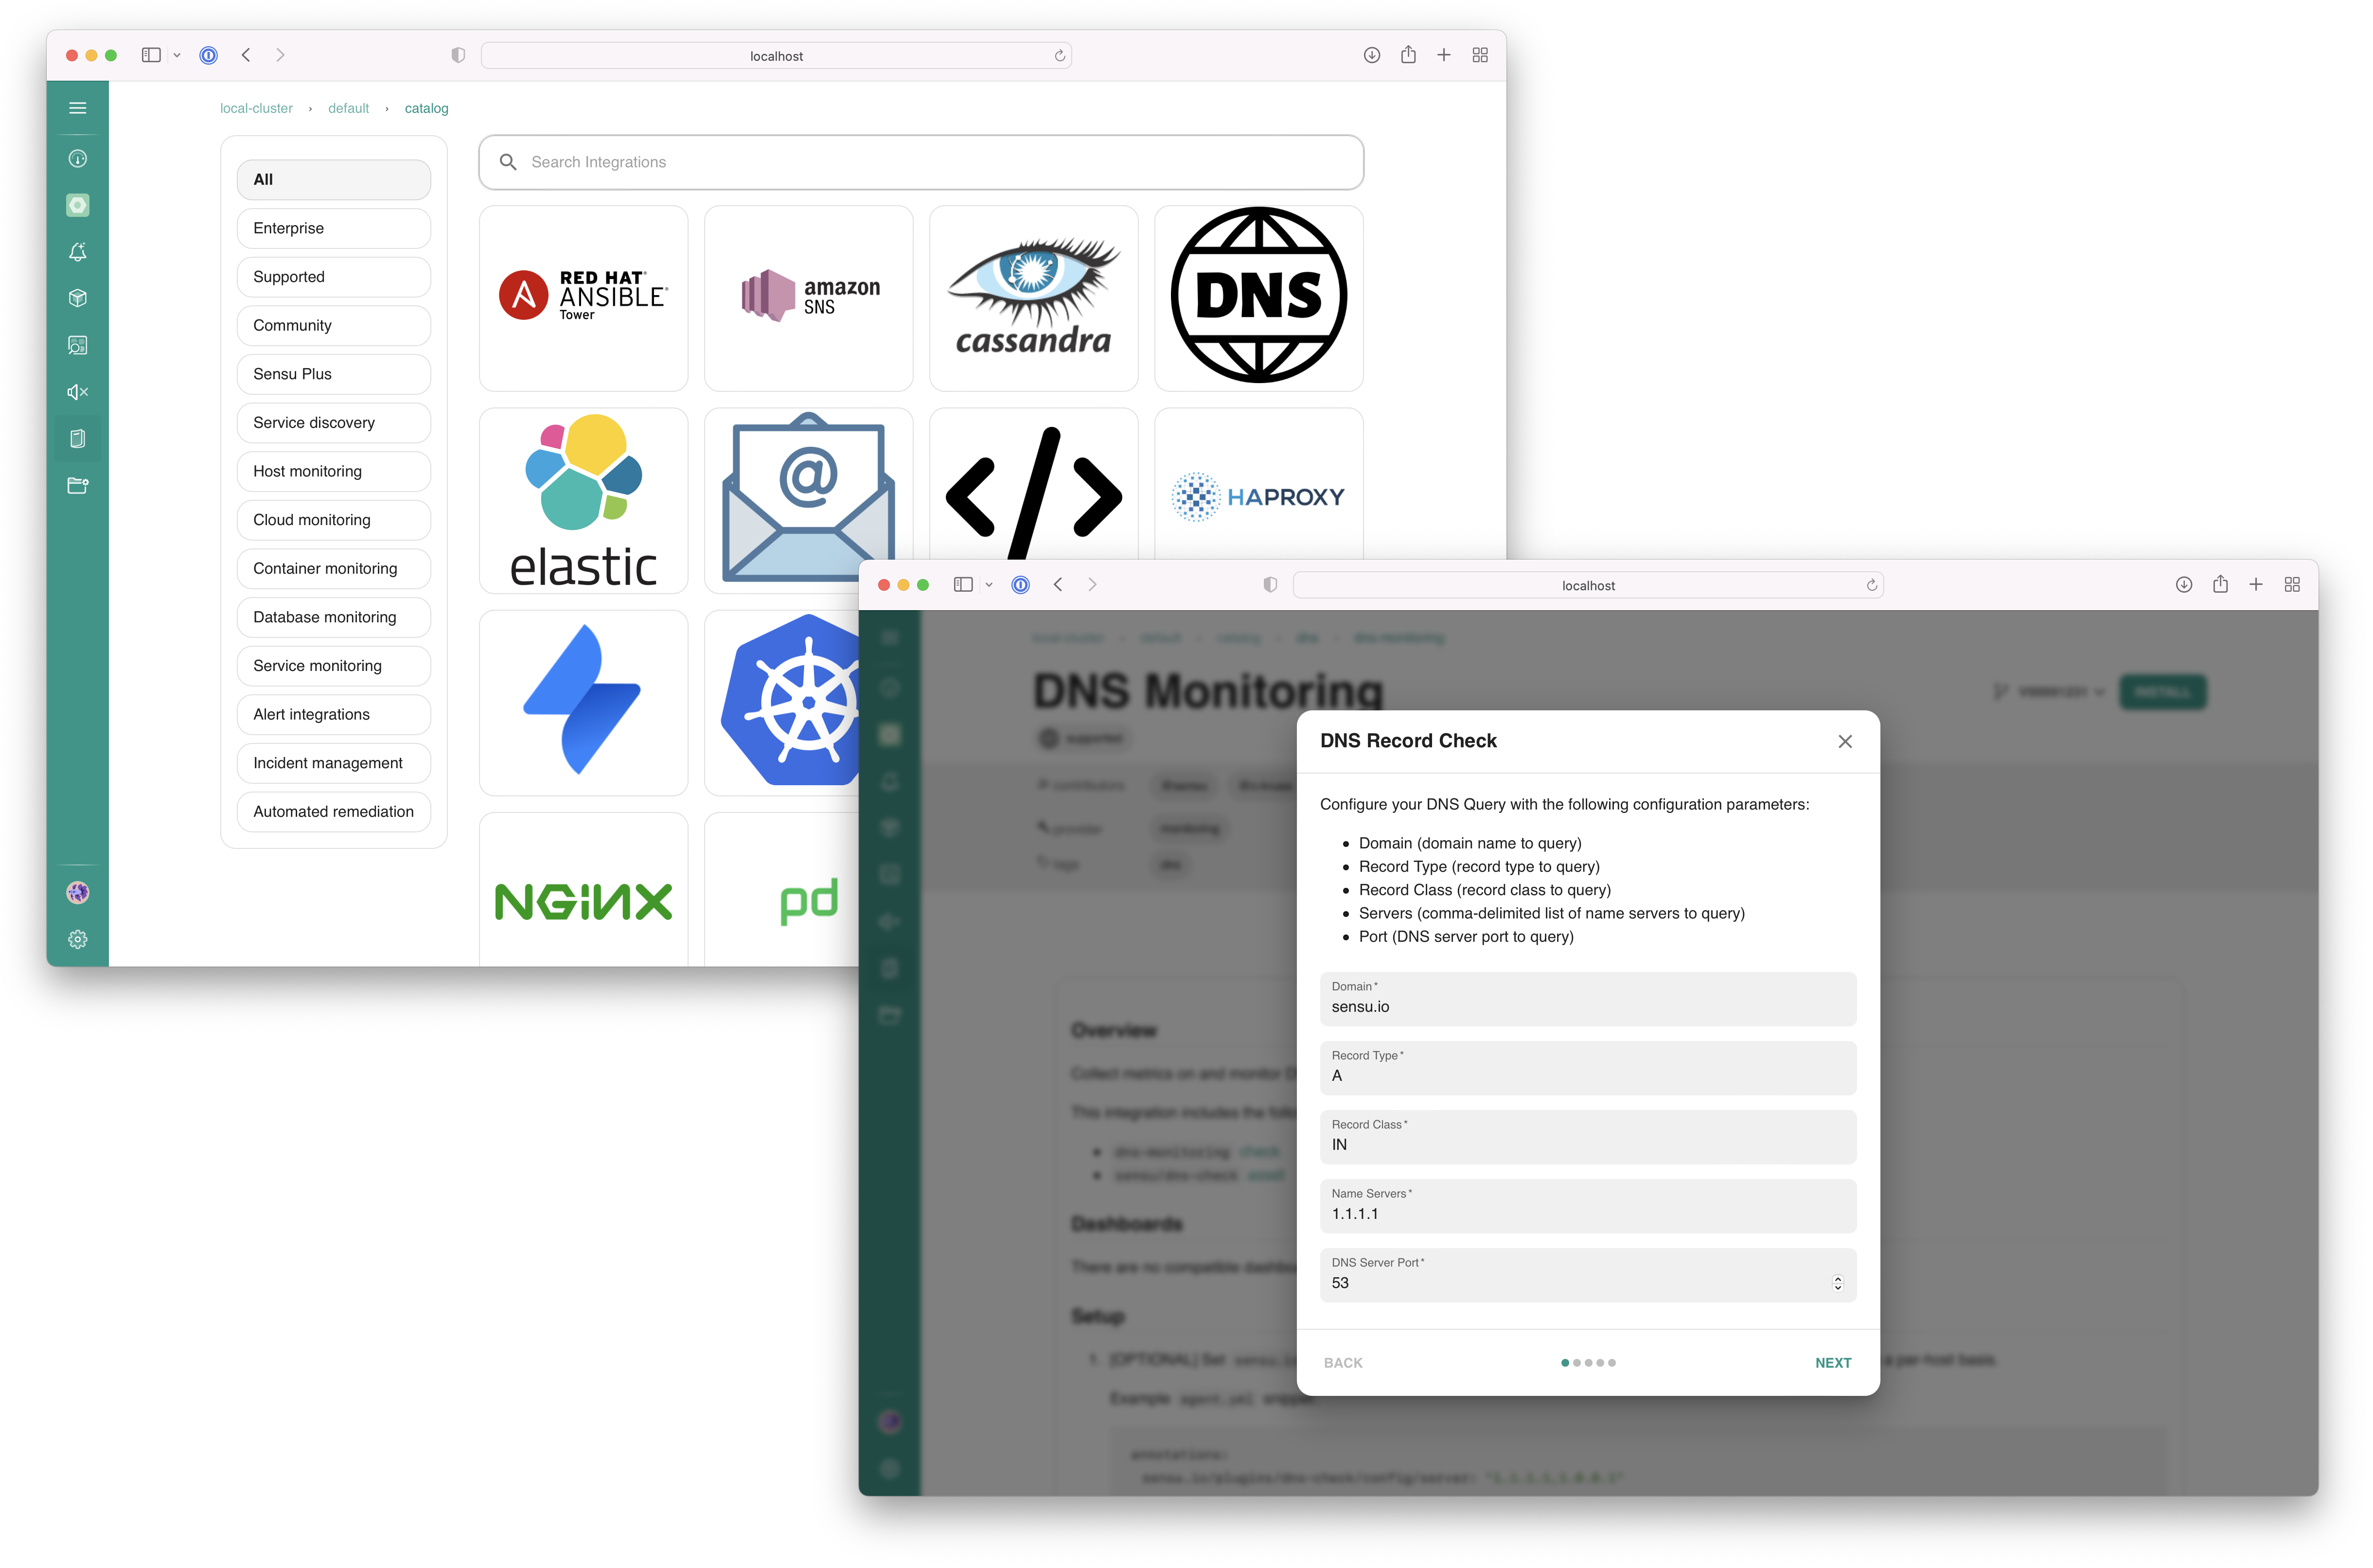
Not only are there monitoring plugins and integrations for every use case, but pre-configured templates offer all the flexibility of monitoring-as-code workflows with no coding required. Our turn-key integrations are backed by declarative configuration templates that can easily be edited, reviewed, version-controlled, and shared amongst teams.
As infrastructure complexity increases, it’s more critical than ever to have a centralized management interface for monitoring. Just as Kubernetes serves as a control plane for container orchestration, so too should your monitoring be able to manage highly complex observability workflows in an automated and repeatable fashion.


Made with #monitoringlove by SensuTM in Canada 🇨🇦 and the USA 🇺🇸. © 2017-2021 – Privacy Statement – Terms & Conditions