This is a guest post to the Sensu Blog by Michael Eves, member to the Sensu community. He offered to share his experience as a user in his own words, which you can do too by emailing community@sensu.io.
 Sensu works quite well for metrics. I’d like to show you how to set it up.
Considering Sensu
When people look for metrics collection for their environment they often look towards the same few solutions like Collectd, Telegraf, etc. This is for good reason: those options provide flexible & extensible metrics collection… and so can Sensu.
If you’re already leveraging Sensu for your service health monitoring it makes a lot of sense to extend that out to metrics since all the infrastructure is already there; it just takes a small number of configuration changes to begin gathering metrics across your entire environment.
For this ‘toe dipping’ walkthrough into Sensu metrics collection I’ll be focussing on configuring metrics collection for implementation with Graphite; however since most TSDB’s accept graphite formatted metrics, this can certainly be used in other cases.
If you’re brand new to Sensu then I recommend having a read through What is Sensu?https://docs.sensu.io/sensu-core/1.4/overview/what-is-sensu/ and then diving straight in with The Five Minute Install. If you have any questions there are helping hands available in the Sensu Slack channel.
Handler Setup
The first thing we’ll look at is setting up the handler configuration that our metrics checks are going to use in order to send data to Graphite.
There are currently two popular methods for handling metrics, both of which come with their own advantages, however which you choose will most likely come down to the scale of your setup.
If you anticipate the rate of your metrics collection is likely to reach into the tens of thousands of metrics/minute I’d recommend you use option #2, however for smaller setups option #1 will see you through just fine.
Option #1: TCP/UDP Handler
Sensu’s TCP/UDP handlers simply forward event data to a specified endpoint when invoked and are amongst one of the easiest things to get setup & running with. The potential downside of using a TCP handler for metrics is that a new connection will be initiated to Graphite for every metric output (i.e. every metric check) you send, which in large environments might not be desirable.
If you’re running a smaller scale setup, or you’re simply experimenting then you need not worry about this being an issue.
To get started let’s take a look at our handler definition, that for this example we’ll be placing in /etc/sensu/conf.d/handlers/graphite.json:
{
  "handlers": {
    "graphite": {
      "type": "tcp",
      "mutator": "only_check_output",
      "timeout": 30,
      "socket": {
        "host": "graphite.company.tld",
        "port": 2003
      }
    }
  }
}
Most of the configuration is fairly self explanatory; we’ve configured a handler under the name graphite that will forward event data over tcp to graphite.company.tld:2003.
We’ve also added a mutator to our handler definition called only_check_output. Without a mutator Sensu will forward the entire event data onto the specified endpoint; since this is a large JSON blob Graphite is going to be baffled and will throw away the data. Instead we need to mutate the data so that we only forward on the useful bit (i.e. just the output).
The only_check_output mutator is a built in Sensu extension, which means we don’t need to perform any additional configuration to begin using it! This mutator will strip out all the event data leaving just the output of the check.
If you plan to have hostnames in your generated metrics it’s worth noting that since they’re dot delimited they will be parsed into separate namespaces in your Graphite tree. If this behaviour is not desirable mutator-graphite.rb is available as an alternative mutator. As well as stripping out all but the checks output, this mutator will either:
- Reverse the hostname in your metrics to provide a better view in the Graphite ‘tree’ (i.e. hostname.company.tld will become tld.company.hostname)
- Convert the periods in the hostname to underscores, preventing the hostname from being split into separate namespaces.
If you choose not to use the built in only_check_output and rather use the graphite mutator mentioned above then you will need to change the mutator name in the handler configuration above to graphite_mutator and then follow the steps below. Otherwise you’re all done, the handler setup is complete.
The graphite mutator can be installed via the sensu-plugins-graphite gem with the below command:
sensu-install -p sensu-plugins-graphite
Now that the plugin is installed we can create a definition for the mutator; in this example we’ll place it in /etc/sensu/conf.d/mutators/graphite_mutator.json:
{
  "mutators": {
    "graphite_mutator": {
      "command": "/opt/sensu/embedded/bin/mutator-graphite.rb",
      "timeout": 10
    }
  }
}
If you want to reverse the hostname in the metrics, rather than convert the periods to underscores, then add --reverse to the above command.
That’s it! The handler is now ready to go!
Option #2: Sensu Metrics Relay/WizardVan
WizardVan is an extension developed by Sensu lover turned employee, Greg Poirier. WizardVan (also known as Sensu Metrics Relay) will scale to meet the demands of large installations; as it benefits from being able to keep persistent connections open to your TSDB meaning it serves great in firehouse situations.
WizardVan also supports outputting to OpenTSDB and can accept metrics input in JSON format which is certainly a desirable feature for some.
So let’s look at setting up WizardVan for use with our metrics collection. Currently WizardVan is not a part of the sensu-extensions organisation so the install process is still a bit manual, but perfectly doable, by following the below steps:
# Clone the WizardVan repo
yum install -y git
git clone https://github.com/grepory/wizardvan
# Copy into Sensu extensions directory
cd sensu-metrics-relay
cp -R lib/sensu/extensions/* /etc/sensu/extensions
Now we can create the config for the metrics relay, in this example I’m going to place it in /etc/sensu/conf.d/extensions/relay.json:
WizardVan will buffer metrics up to a specified size before flushing to the network. This is controlled with the max_queue_size parameter shown above (default is 16KB). If you want metrics to be flushed immediately you can set this to 0.
You can also specify additional output types in the above relay config, see the README.md for an example.
Metrics Check Setup
Now that we have a working handler we can look at setting up our first check that we can utilise to generate metrics.
The first thing to do is find a check that will generate the metrics you desire. The sensu-plugins organisation is chock-a-block full of plugins that come bundled with metrics checks, or alternatively you could choose to write your own. For this example we’re going to gather metrics on CPU usage using metrics-cpu.rb found in the sensu-plugins-cpu-checks gem.
We can install this plugin using the sensu-install utility:
sensu-install -p sensu-plugins-cpu-checks
Now we can write our check definition. The below example should be used if you’ve decided to use a TCP/UDP handler; there’s also some recommended modifications later on if you’re instead using WizardVan/Metrics Relay.
In this example we’ll place it in /etc/sensu/conf.d/checks/cpu_metrics.json:
{
  "checks": {
    "system_cpu_metrics": {
       "type": "metric",
       "command": "/opt/sensu/embedded/bin/metrics-cpu.rb --scheme sensu.:::service|undefined:::.:::environment|undefined:::.:::zone|undefined:::.:::name:::.cpu",
       "subscribers": [
         "system"
        ],
        "handlers": [
          "graphite"
        ],
        "interval": 60,
        "ttl": 180
     }
   }
}
It’s important that "type": "metric" is defined; this ensures that every event for the check is handled, regardless of the event status (i.e. even OK results will be handled).
Metric Naming
Most of the community metrics checks will have a default metric naming scheme of $hostname.$check_purpose appended by the metrics themselves. Using the plugin above as an example a single metric will look something like this: ip-10–155–16–194.cpu.total.user 5824723 1511389085.
If you’re using very descriptive & static hostnames this can work pretty well, however the chances are your hostnames are randomly generated and change all the time. Most of the metrics check will provide a command line flag (typically —-scheme) to override this default naming scheme. With this in mind we chose to set service identifying attributes on all our Sensu clients, and then substitute these into our metrics commands to give meaningful metric names; making use of Sensu’s token substitution.
If you’re interested here’s the attributes we chose to set:
- Service: This is defined as the name of the application or service. Examples could be a custom in-house application (i.e. customer-billing-service), or an open source application (i.e. logstash)
- Environment: This is a flexible attribute that can be used to define the specific environment of an application (i.e. dev/qa/prod), or a specific layer of a stack (i.e. shipping/indexing)
- Zone: We use zone to identify the physical location of the node in question (i.e. eu-west-1,nonprod-dc2)
- Name: This is simply the Sensu client name, which will typically be your machines hostname
With the above attributes set, we can substitute them into the check command so that every metric has a well defined schema, that allows easy navigation of metrics:
"command": "/opt/sensu/embedded/bin/metrics-cpu.rb --scheme sensu.:::service|undefined:::.:::environment|undefined:::.:::zone|undefined:::.:::name:::.cpu",
Since we were already using Graphite with other metrics sources it was felt best to put all the Sensu generated metrics under a single top level key: Sensu. This makes it clear which metrics have been generated via Sensu which helps with distinguishing sources of metrics, as well as making it easier to calculate usage/volume of Sensu metrics.
Service Level Metrics
Some metrics you collect might not be node specific metrics, but rather metrics that cover a clustered service, or are pulled from a 3rd party API. In these cases it makes little sense to have the metrics be name spaced under the hostname they were generated on, rather you probably want them in one clear place.
We found the easiest way to achieve this was to run check definitions similar to the below for those cases:
{

  "checks": {
      "elastic_elasticsearch_cluster_metrics": {
         "type": "metric",
          "command": "/opt/sensu/embedded/bin/metrics-es-cluster.rb --allow-non-master --scheme sensu.:::service|undefined:::.:::environment|undefined:::.:::zone|undefined:::.cluster",
          "subscribers": [
            "roundrobin:elasticsearch"
          ],
          "handlers": [
            "graphite"
          ],
          "interval": 60,
          "ttl": 180,
          "source": "elasticsearch"
        }
    }
}
The key differences here are:
- The hostname is excluded from the metric name, instead replaced with something to identify the scope that the metrics represent; in this case an Elasticsearch cluster.
- The check is issued via a roundrobin subscription, as it just needs to be ran on one of any of the Elasticsearch nodes at a time.
- A source of elasticsearch is set. Since we’re using a roundrobin subscription you’ll want to use a proxy client so that the metric results all appear under the same client so that the TTL still works and you also know where to look if you want to see the current status of the check!
WizardVan Considerations
As mentioned above if you have chosen to use WizardVan there are some changes you will need to make on the example check definition provided above.
In the example above we specified our handler name as graphite, since that is what we defined in our TCP handler. When using WizardVan however the handler you will need to set is instead called relay:
"handlers": [
 "relay"
],
Next, if your check is not going to be outputting in Graphite format but rather another supported type, you will need to specify the output type in your check, i.e. "output_type": "json".
Lastly, default WizardVan behaviour is to prepend the nodes hostname (in reverse) to the generated metrics; as such you may want to adjust the naming schema you choose in your checks. Personally, I’d choose to disable this behaviour and instead be explicit in how you choose to name your metrics. This can be achieved by setting "auto_tag_host": "no" in your check definition. Unfortunately this can not currently be controlled via global configuration, however you could change the following line to change the default behaviour of this flag.
Wrap Up
At this point you should have metrics streaming into your TSDB from Sensu, and hopefully it was straightforward to get setup.
To review: I proposed two methods, of which I’ve found to be the most popular, for getting your metrics into Sensu. There are, however, even more implementations available that could suit your environment better:
InfluxDB: https://github.com/sensu-extensions/sensu-extensions-influxdb2
Statsd: https://github.com/sensu-extensions/sensu-extensions-statsd
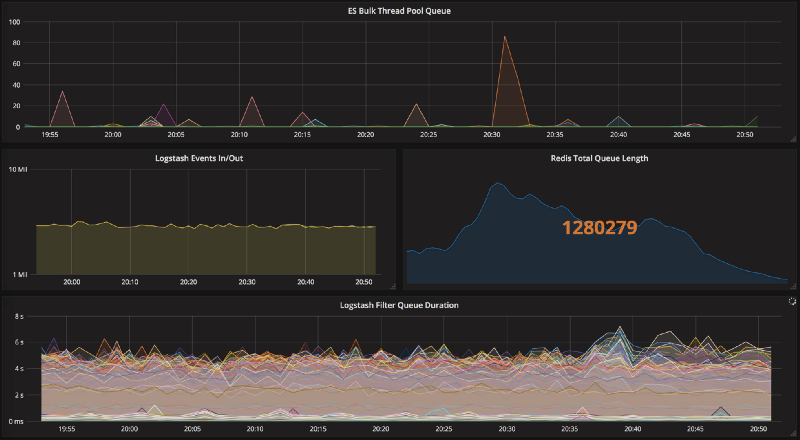
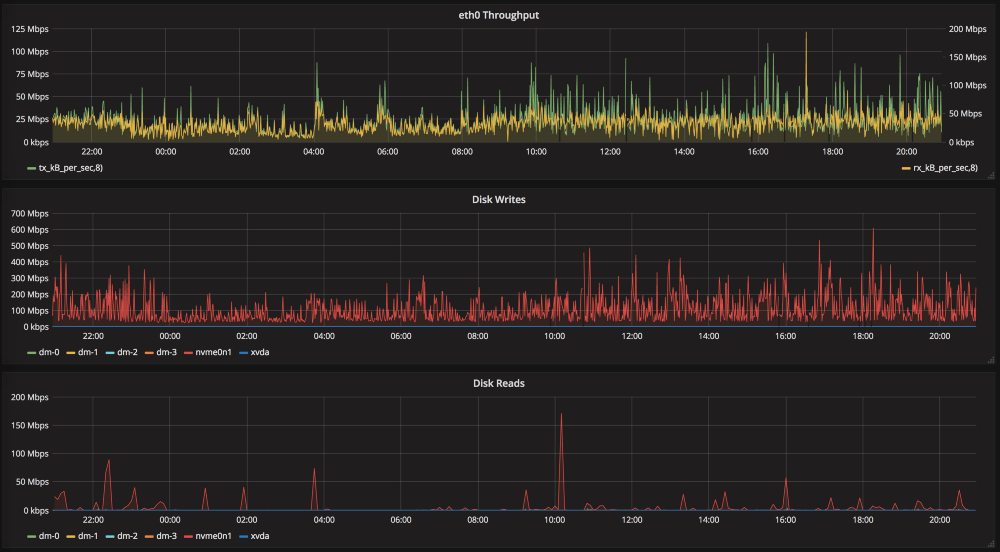
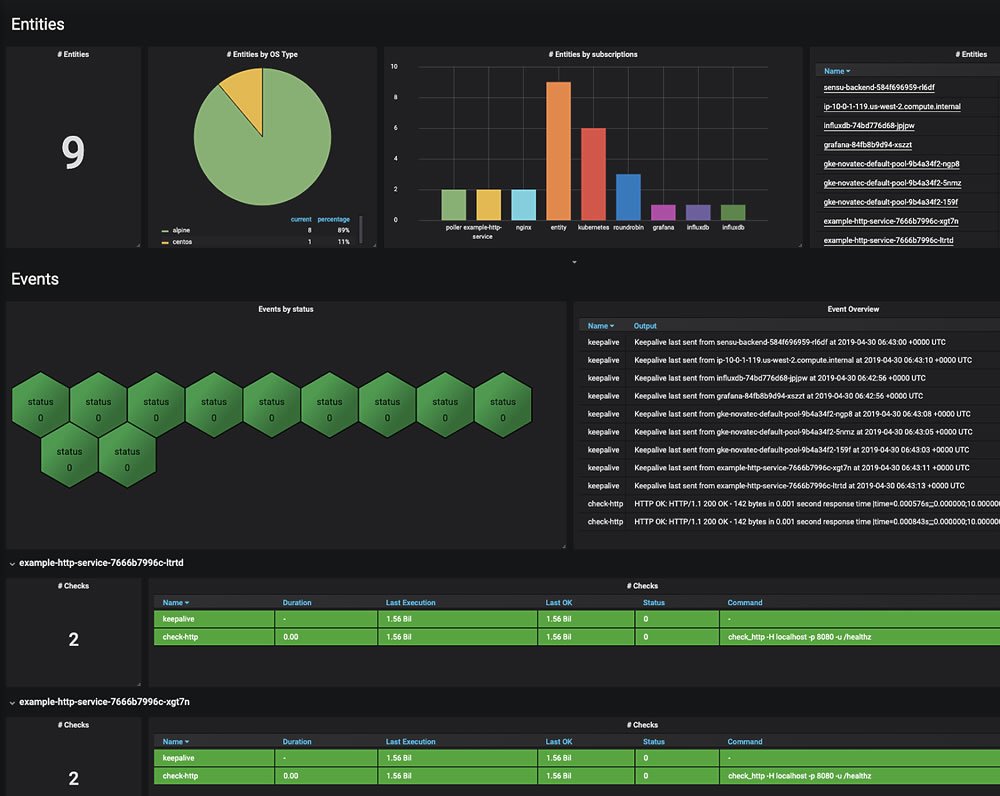
If you’re wondering where to go now you might consider using Grafana to setup templated dashboards based on your metrics. You can then set a URL in your client attributes to link straight through to a dashboard for a given client. You could also embed the graphs directly into the client as this blog post guides you to do.
No matter how you proceed, if you need a hand thinking through how to configure your environment, you can find me on the Community Slack. I’m happy to help. Good luck!

This is a guest post to the Sensu Blog by Michael Eves, member to the Sensu community. He offered to share his experience as a user in his own words, which you can do too by emailing community@sensu.io.


