Why Sensu is a compelling Nagios alternative for DevOps and SRE teams
If you have worked in any part of the application delivery lifecycle long enough, there’s a very good chance you have directly used or been a consumer of Nagios. For a period of time in the early 2000s, it was the go-to solution for basic server monitoring and alerts. Fast forward 20 years and you might be surprised how many organizations still rely on Nagios for mission critical workloads — although not without a fair amount of duct tape and super glue challenges. If you work at one of these organizations, you may be familiar with these limitations and actively working on migrating core infrastructure and application monitoring to a modern solution designed for cloud-native operations. In this blog post, we’ll cover some common Nagios limitations, and corresponding solutions available in Sensu Go — including built-in support for reusing Nagios plugins and automating monitoring for public cloud and cloud native workloads.
Nagios was released in 1999 — an era before public cloud and cloud-native computing. It found success thanks to an incredibly simple interface: the service check. Any program that can communicate status via a set of known exit status codes and emit at least one line of standard output is a valid Nagios service check! If you have found yourself in need of a solution to monitor the health of a service or infrastructure component — and you wrote a script or small program to fill the gap — you have written a service check without even knowing it! Although the service check is still as relevant and useful as ever, Nagios’ configuration model has prevented it from being adapted to cloud native use cases. Requirements around predefined “host” objects and tight coupling between monitors and individual hosts have proven to be incompatible with elastic compute platforms and modern practices like auto-scaling groups.
Sensu is an observability control plane (configuration API and scheduler), lightweight monitoring agent (service check execution + edge collection APIs), and programmable observability pipeline (extensible event processing engine). Sensu Go eliminates challenges related to host-based monitoring — cumbersome and fragile configuration — via its service-based configuration model and pub/sub architecture. Some popular Sensu use cases include consolidating monitoring tools (including Nagios, StatsD, Telegraf, and Prometheus), and eliminating data silos by aggregating observability data in the data platform of your choosing (including Sumo Logic, Splunk, and Elasticsearch).
Where Nagios’ tight coupling between hosts and other configuration objects makes configuration somewhat brittle, Sensu takes a more declarative approach to monitoring configuration, with loose coupling between resources, making it safer to apply changes to individual monitoring workloads without fear of impacting dependent objects.
The differences in these configuration models may make migration seem like a daunting task. However, with a little forethought, it’s quite easy to migrate from Nagios to Sensu Go.
Translating Nagios configuration objects to Sensu concepts
Because Nagios and Sensu organize resources differently, it is important to mentally map some key concepts from one structure to the other. This will greatly ease the migration.
Nagios NRPE service ➔ Sensu Agent:
Perhaps one of the most important differences between Nagios and Sensu is that Sensu backends do not directly execute service checks. All Sensu checks are executed by a Sensu agent. In effect, the Sensu agent is a superpowered replacement for NRPE. The sensu-agent service running on a remote system registers itself with the Sensu backend and communicates via a long-lived websocket connection.
In addition to replacing NRPE, the Sensu agent also eliminates the need to pre-define host objects – a problem most Nagios users have been trying to solve for many years that becomes quite complex as you adopt public cloud and start dealing with elastic infrastructure (e.g. auto-scaling groups).
Nagios service object ➔ Sensu check:
The Nagios service object maps almost directly to a Sensu CheckConfig resource. When planning your migration, the Nagios service objects represent the functionality you want to migrate. Other Nagios objects most likely won’t need to be migrated at all.
Nagios command object ➔ Sensu check/handler command:
Sensu has no command object, and instead, commands are attributes of the Sensu CheckConfig and Handler resources. When migrating a Nagios service, the referenced command object for check_command and event_handler will need to be translated explicitly.
Note that Nagios commands will most likely need to be edited to replace the use of Nagios macros with Sensu Token substitution – a more flexible solution for variable substitution providing access to template check configuration using Sensu entity metadata (host properties, or customs labels and annotations). Sensu Token substitution allows you to use Sensu entity labels and annotations to modify various parameters in check command operation. For example, disk usage alert threshold for different hosts might need to be tuned based on the host workload; token substitutions let you do this.
Nagios host group ➔ Sensu subscriptions:
Sensu Check Subscriptions represent a loose coupling between your Sensu monitoring configuration (i.e. Sensu checks define what monitoring data to collect), and the target hosts, compute instances, and containers/pods (i.e. Sensu agents).
Sensu Subscriptions work like “topics” in a traditional publish/subscribe message bus, and they are the secret to unlocking true service-based monitoring in Sensu. Sensu backends “publish” service-based monitoring requests to topics (Sensu “subscriptions”), and Sensu agents “subscribe” to these same service-based topics.
When migrating from Nagios, you’ll want to start by preparing to replace each Nagios host group to a similarly named Sensu subscription. Then, as you translate Nagios host and service objects to Sensu entity and checks, you can apply the appropriate subscription to connect the entities and checks into the similar Nagios service host group.
Nagios host ➔ Sensu Entity:
A Sensu Entity translates nearly directly to a Nagios host object. When Sensu agents register with a Sensu backend, a corresponding Sensu entity resource is automatically created. You do not have to build an entity definition manually for each running Sensu agent.
One thing to note, Sensu agents provide a built-in heartbeat mechanism called keepalives, so there is no need to migrate Nagios host checks. If you are using a more specialized host check in Nagios, you can easily convert that into a Sensu service check instead.
Nagios service event_handler ➔ Sensu pipeline:
Nagios services can include an event_handler attribute that references a Nagios command object that processes the Nagios check output (ex: conditional email based on non-zero return status). The corresponding Sensu resource to Nagios event_handler command objects is the Sensu Event Handler (specifically a Sensu pipe handler). You won’t be able to translate Nagios event handlers directly to Sensu handlers because the event data models consumed by each handler concept are so different. But you should be able to find an existing Sensu handler plugin that meets most of the common Nagios event handler activities such as exporting to an alerting service, or sending email, or exporting metrics to an intelligence service such as Sumo Logic.
Where Sensu differentiates itself from Nagios is in its ability to configure event processing Pipelines. Sensu pipeline resources are composable event processing workflows that you can reference in Sensu check configurations. Instead of specifying a single command, pipelines make it possible to filter, transform and process the Sensu event data in multiple distinct workflows. Pipelines provide a secondary publish/subscribe mechanism in the Sensu Observability Pipeline, enabling collaboration between teams who may have shared interest in observability data collected by Sensu. In cases where data needs to be analyzed in different systems of record, Sensu can collect the data once and route it to multiple destinations.
Note: Sensu uses a loose coupling between resources, so checks can reference pipelines that don’t exist, making it easier for you to extend your monitoring incrementally without fear of breaking your configuration. The monitoring data will still be collected, and the resulting event will still appear on your Sensu dashboard, but if the referenced pipeline doesn’t exist, Sensu will simply treat it as a “no-op.”
Nagios notification_command ➔ Sensu handler:
The Sensu event pipeline concept spans both remediation and notification. When transitioning from Nagios to Sensu, you’ll need to audit the Nagios notification commands you have defined in your contacts and plan to transition to using similarly defined notification based handlers.
Nagios service_perfdata_command ➔ Sensu metrics pipeline:
Nagios lets you define a systemwide perfdata command that will allow you to process all service check perfdata. Sensu agents provide built-in support for Nagios perfdata as timeseries metrics — one of several metrics formats the Sensu agent knows how to ingest! The Sensu agent will translate collected Nagios perfdata into an internal tagged metrics point format suitable for export into any modern time series database.
To learn more about Sensu’s performance-optimized metrics collection, normalization, and processing capabilities, please visit the Sensu Metrics reference documentation.
Nagios object inheritance:
Nagios object configuration typically relies on inheritance from nested template objects. As a result, it can be more than a little confusing to decipher the monitoring configuration in a long-running Nagios deployment. Taking ownership of a long-running Nagios deployment can be quite intimidating due to the potentially cascading effects of configuration inheritance. When preparing a Nagios migration, you’ll want to keep an eye on object inheritance to avoid surprises.
Sensu configuration resources are declarative, and do not support object inheritance between resources of the same type. Operationally, this makes it much easier to audit Sensu resource configuration and much safer to make changes to individual resources without fear of a cascade of behavioral changes.
Migrating check example: remote host load
Starting point:
- Remote linux hosts you want to monitor:
- NRPE service is installed and configured to allow
check_nrpeNagios plugin running on the Nagios service host to connect. check_loadNagios plugin is installed.
- NRPE service is installed and configured to allow
- Nagios server host:
- Nagios server is installed and configured to run check_load on remote hosts using the check_nrpe plugin.
- Nagios service has an admin contact email configured for notifying service state changes via email.
- Sensu backend host (Note: This could be the same host as the Nagios server):
- Sensu backend is installed and initialized with admin user/password.
- Firewall rules allow connection to the Sensu backend’s agent websocket port, so remote Sensu agents can register.
- Sensuctl is installed and configured.
- For now let’s use the default Sensu namespace.
- Sensu backend is installed and initialized with admin user/password.
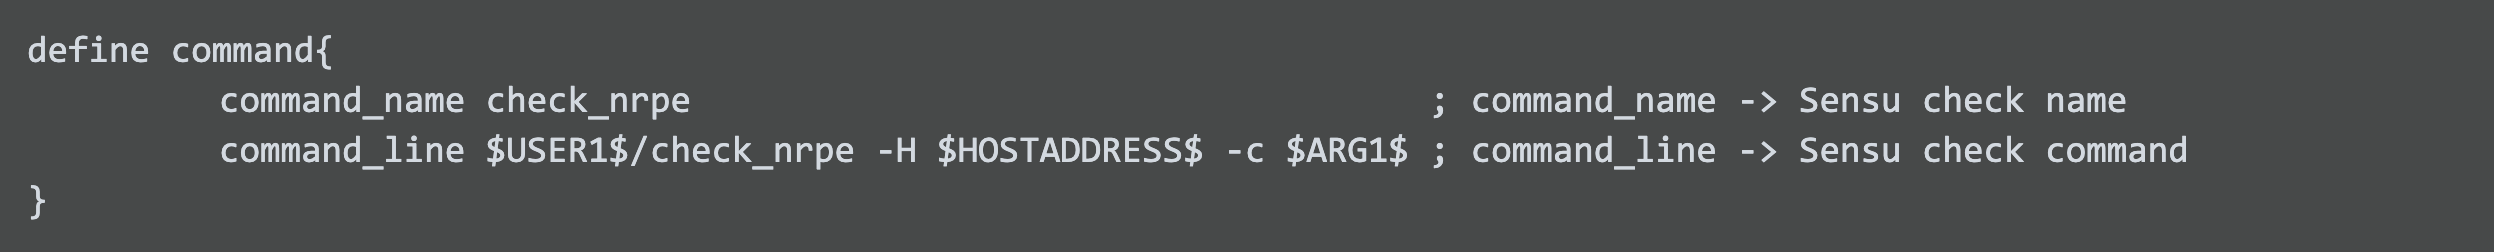
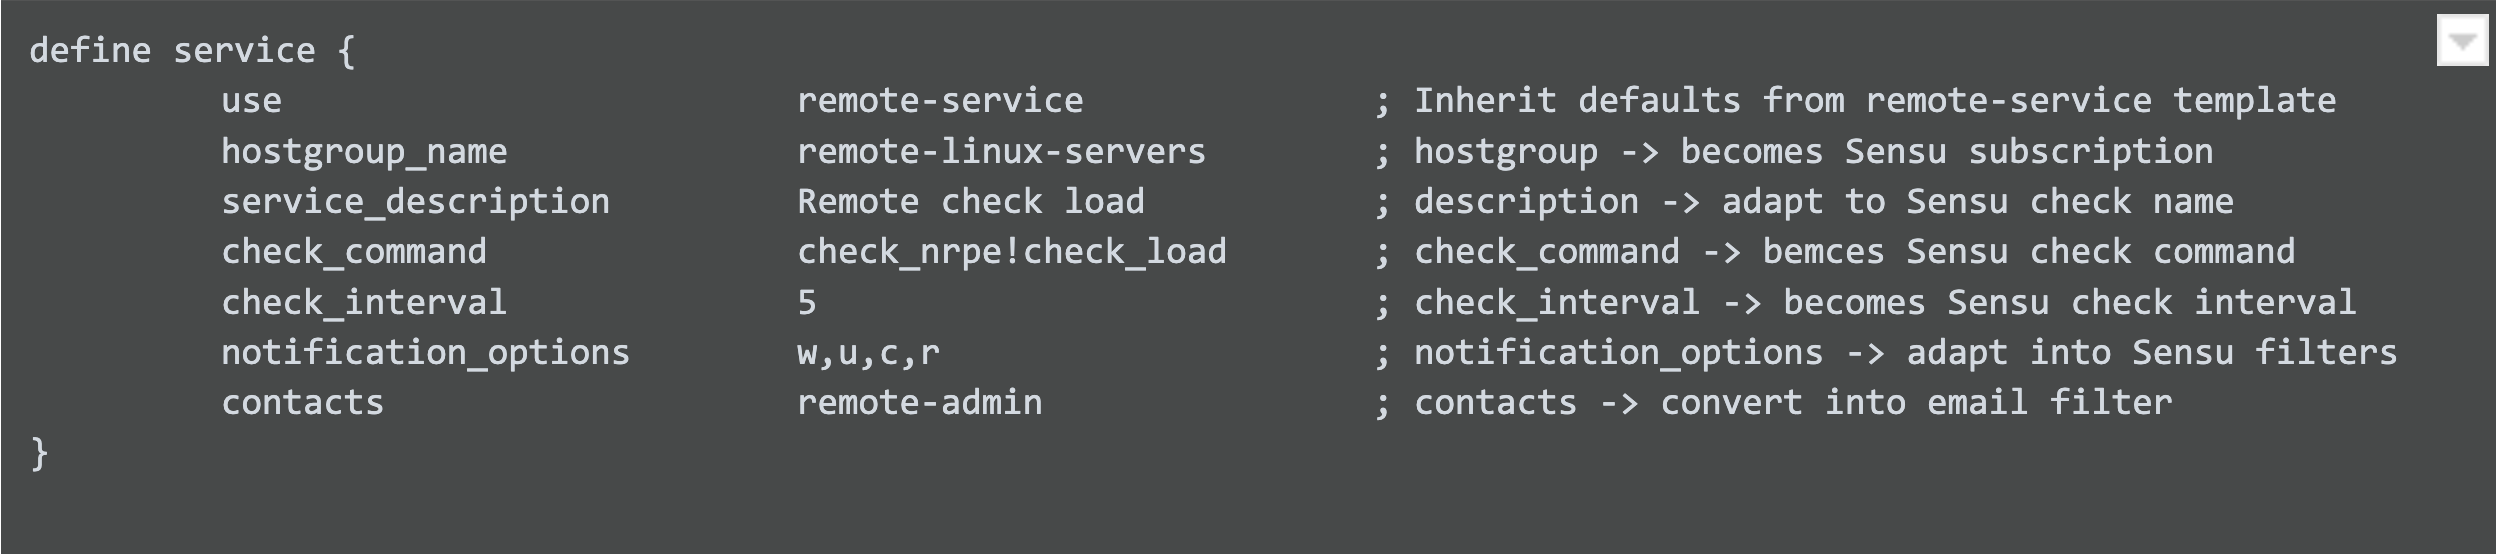
Step 1: Migrate Nagios service and command objects
Initial Nagios Objects:
Here’s the yaml representation of the corresponding Sensu check:
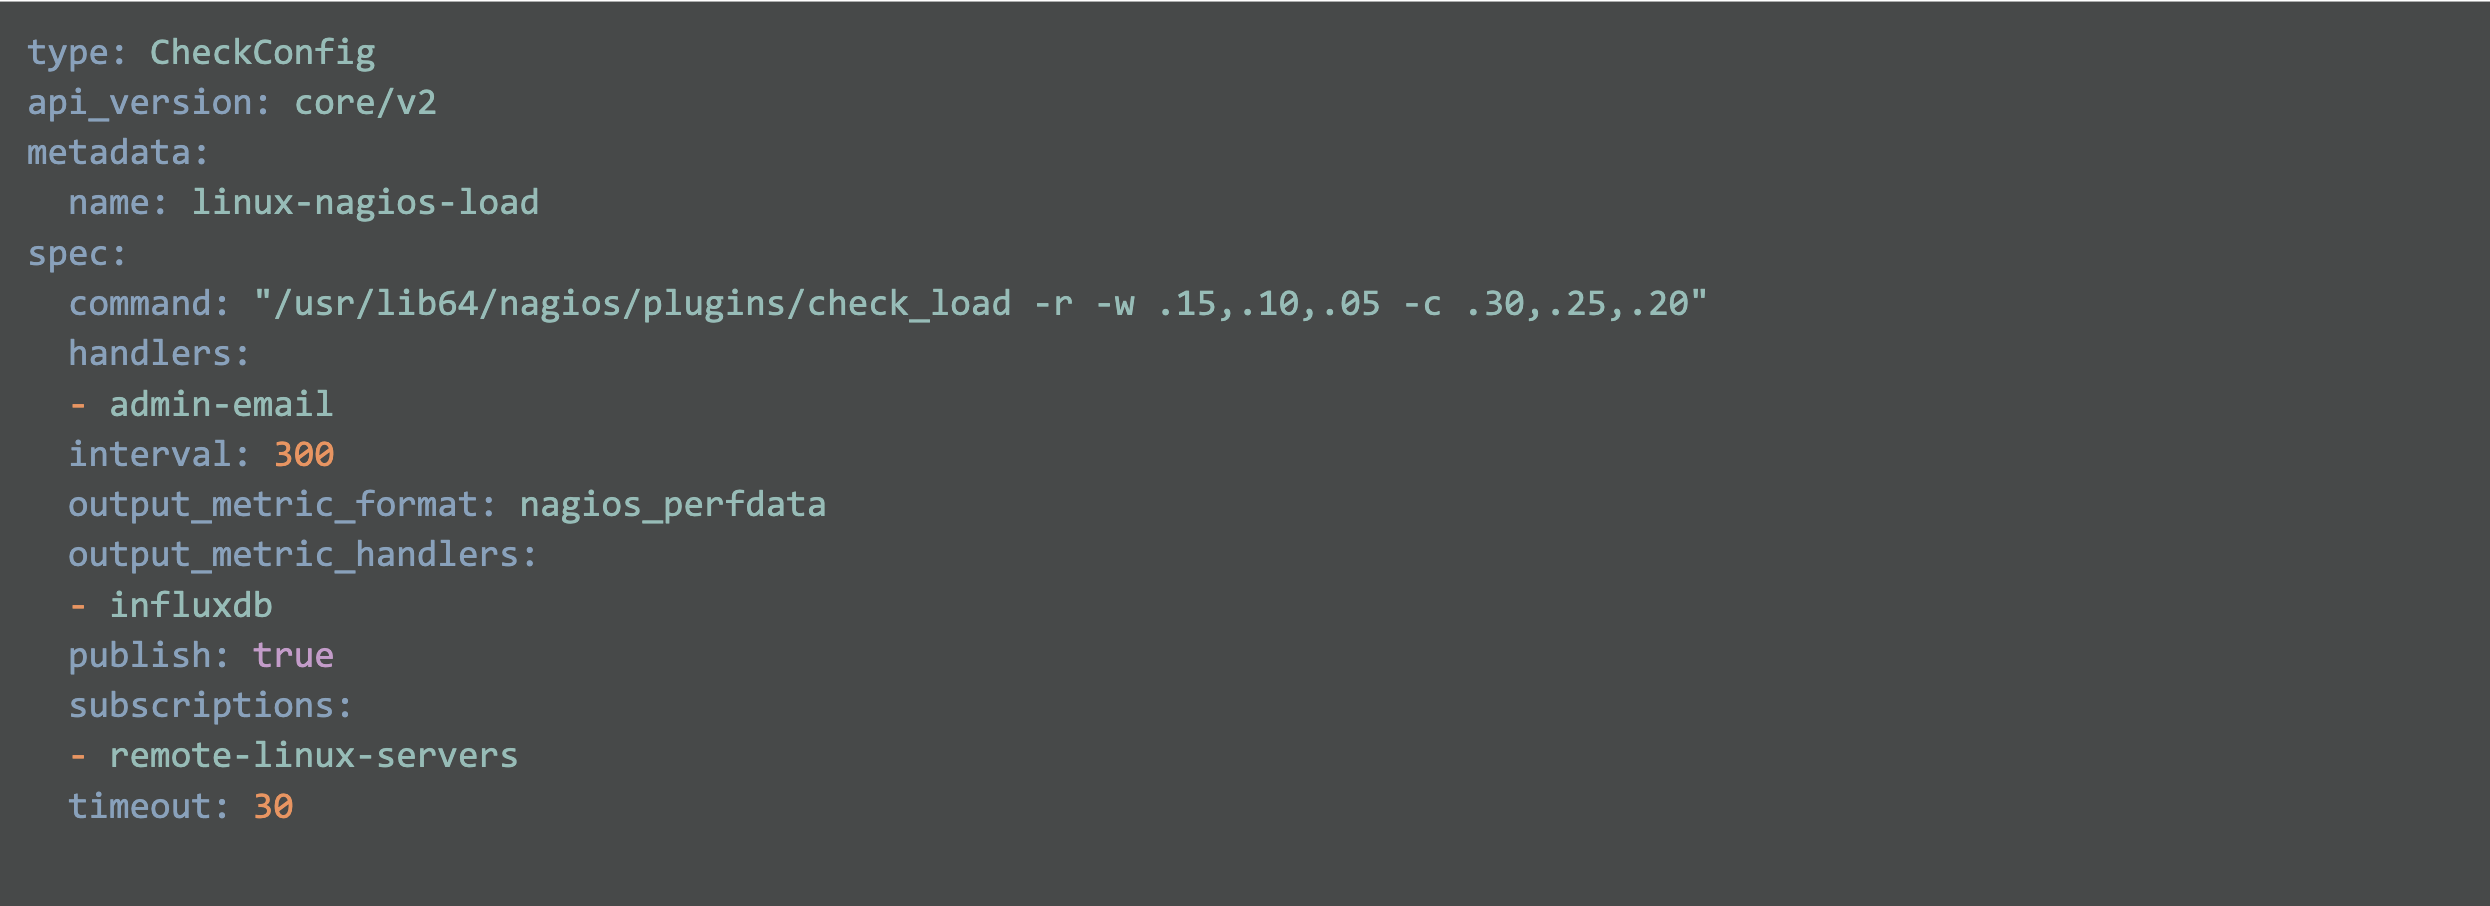
The specifics of the check command were constructed from the nrpe.conf file on the remote host running the NRPE service. Once loaded into Sensu using the sensuctl create -f command, all we need to do is get the remote host running the sensu-agent and configured to participate in the remote-linux-servers subscription.
Step 2: Configure sensu-agent
Install agent and configure it to use the subscription matching the check configuration.
Here’s the base agent.yml that we need:
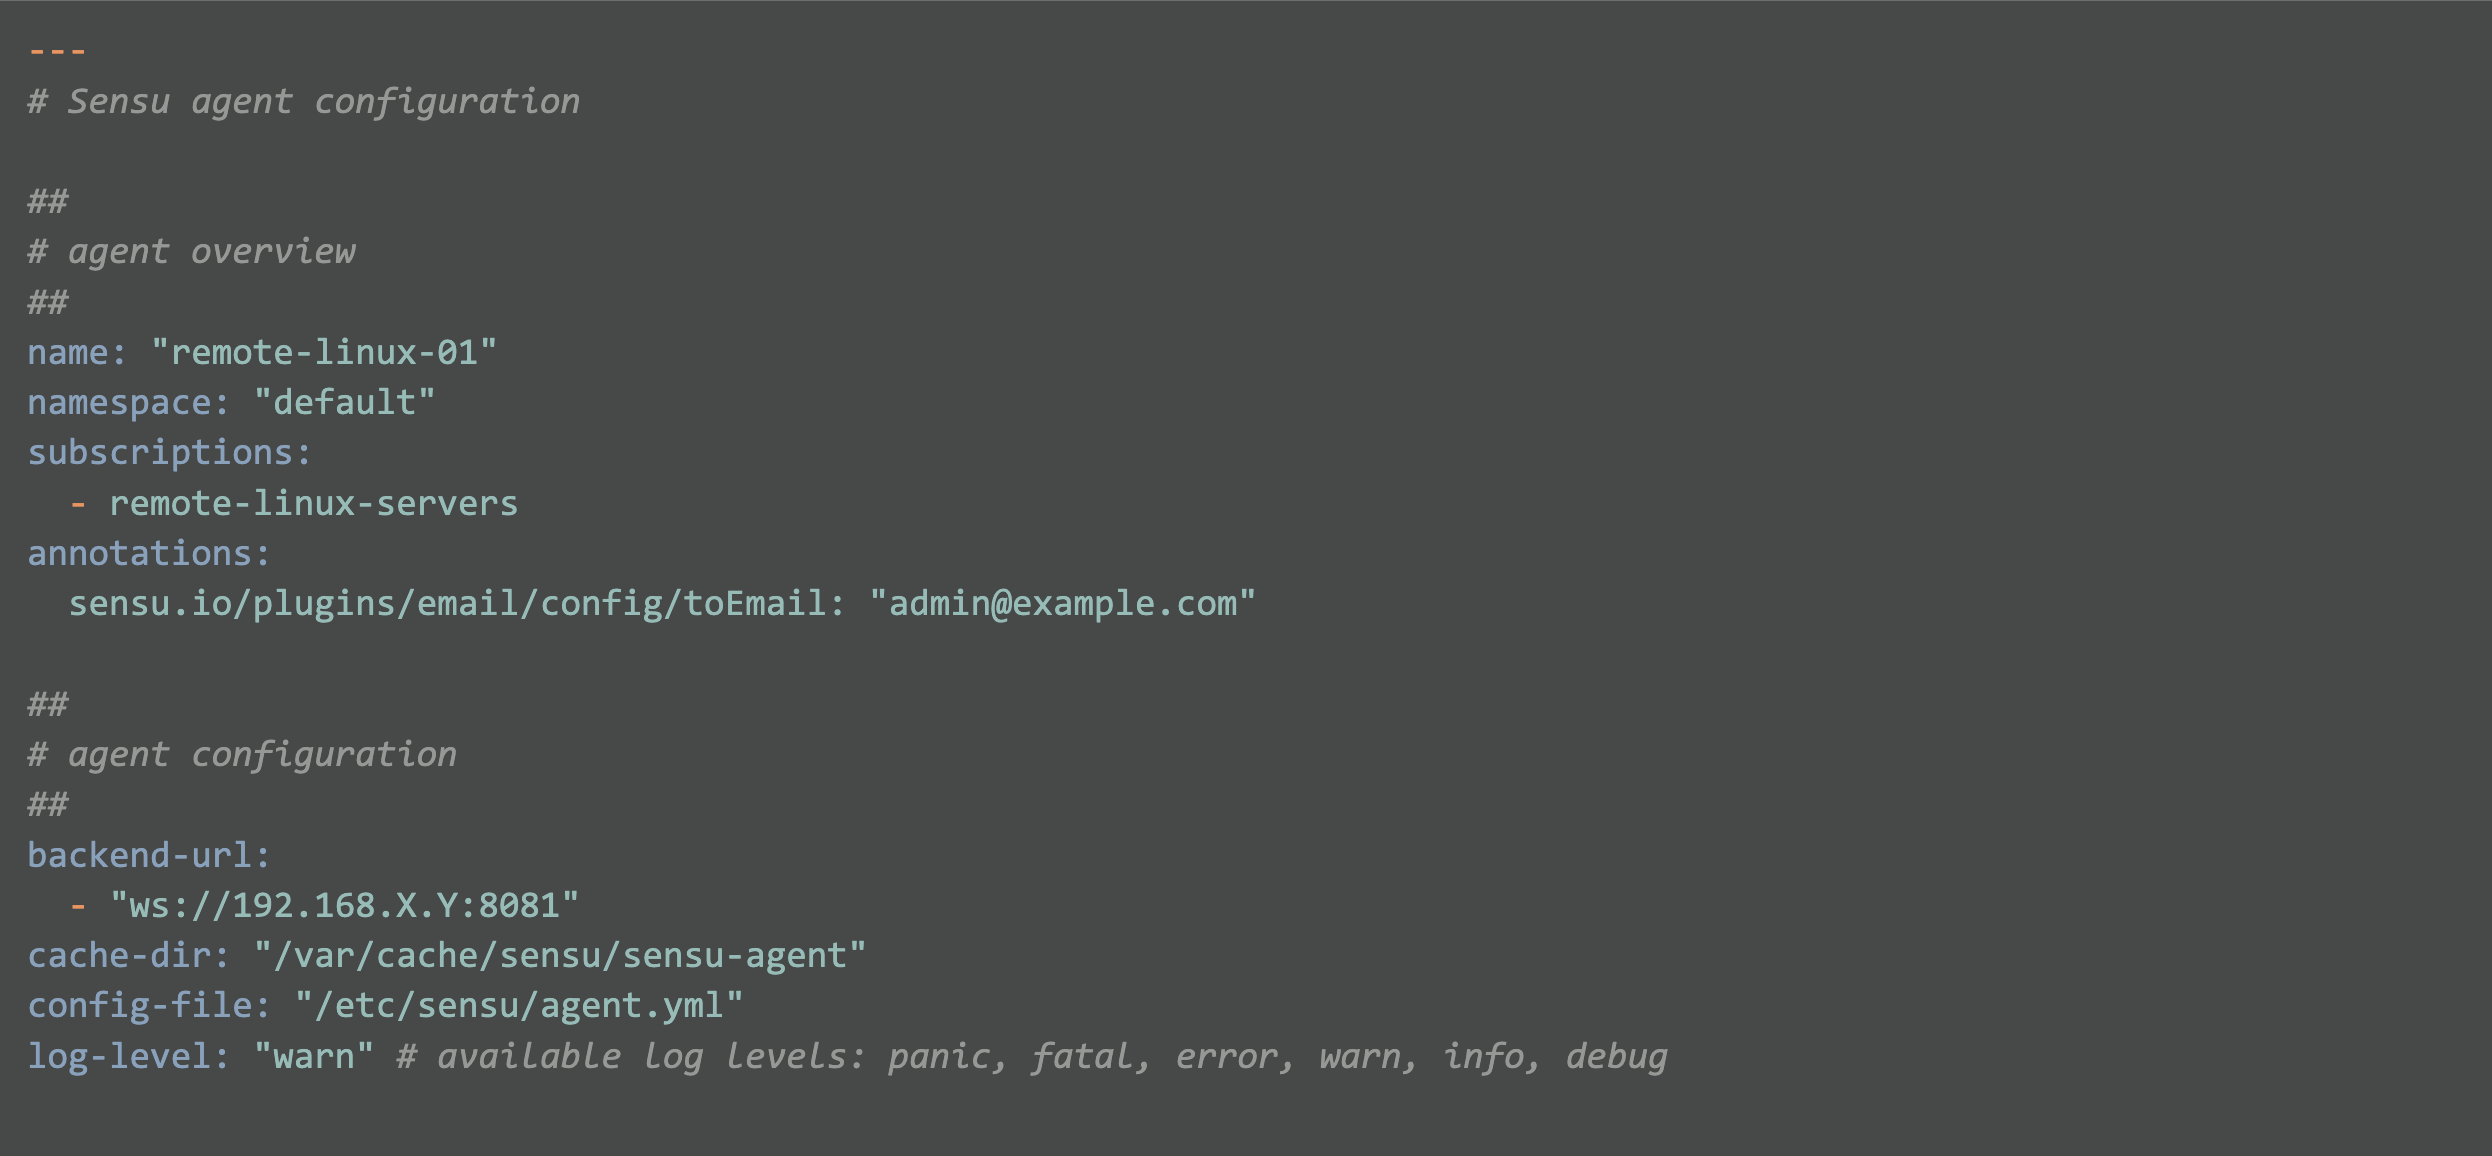
Note: Make sure that the firewall protecting the Sensu backend allows connections to the agent websocket port (tcp 8081 by default).
Note: Configuring TLS encrypted communications is left up to the reader, but if you have TLS based NRPE connections already configured, it shouldn’t be too much trouble for you to add or adapt the certification configuration for Sensu.
Step 3: Start the agent
When you start the agent, the agent will self-register with the sensu-backend and show up in the Sensu entity list on the backend, which you can display using sensuctl.
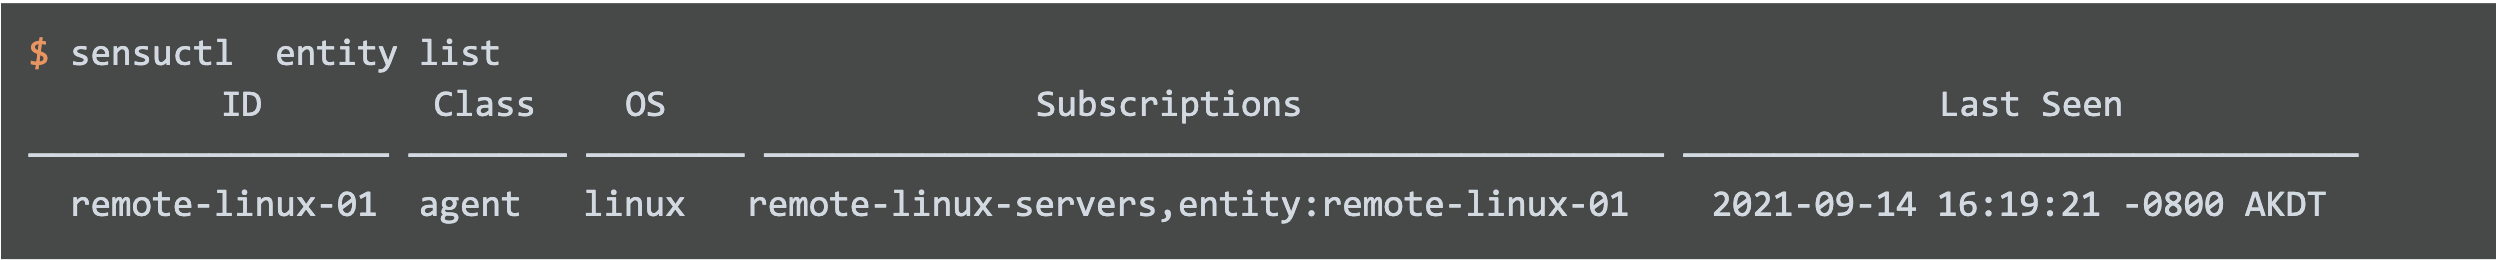
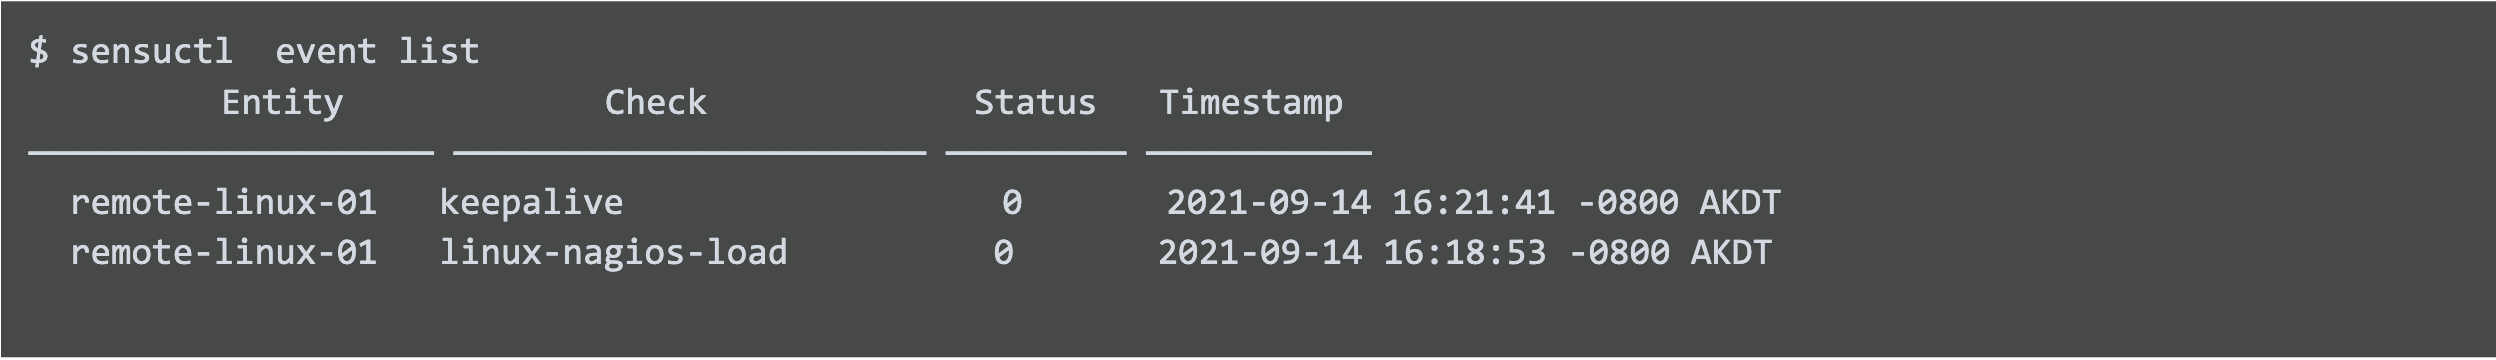
Step 4: Watch Sensu generate events
As soon as the agent is communicating with the backend, it begins to generate a keepalive event that is functionally equivalent to the Nagios host check.
And the system load service check we migrated from Nagios will be scheduled according to the check configuration’s interval setting.
Step 5: Setting up the email handler
Now we need to configure the Sensu sensu-email-handler plugin to provide an email to the correct email address. We can grab the email configuration template from the Sensu catalog repository and make some small configuration edits and we’re all set to get emails for service state changes. You’ll notice I went ahead and added the annotation to the agent configuration itself that the sensu-email-handler will use instead of the fallback email defined in the handler definition. The agent annotation will ensure email notifications are sent to the correct email address for this particular host. If no annotation is provided, the default email configured in the handler configuration is used instead.
Step 6: Add second agent with different warning threshold annotations
The initial check command has hard coded warning and critical values. But we can abstract this, so that each agent can be annotated with custom settings using Sensu token substitutions.
First, we can update check definition’s command:

Now we are able to control the warning and critical thresholds on a per host basis, and still default to usable fallback thresholds for hosts that are not annotated. The Sensu token substitutions work by using go templating. In this example the go template index function is being used to request the value of the agent’s load_warning annotation. If that doesn’t exist the default value is used instead. This construction lets you tailor the check_load executable’s warning threshold for different workloads if needed while still having a sane fallback value.
Going further
Capture Nagios plugin performance metrics
Did you know that many Nagios plugins provide performance metrics as well as status? Sensu agents can ingest Nagios performance metrics (along with other common metrics formats such as prometheus exposition format) and then send those metrics into a time series database of your choice for trending or later examination by your incident response team. Check it out!
If you go back and look at the Sensu check configuration above, you’ll see I sneakily set the needed output metrics format and metric handler attributes already. The Sensu agents running the check are ingesting the Nagios check_load plugin perfdata and sending into my influxdb time series database.
Streamline your configuration management with Sensu assets
The instructions above will get you started on migrating existing Nagios legacy workloads, but there are advanced features in the Sensu monitoring as code model that you’ll want to take advantage of. For example, instead of pre-provisioning all the needed Sensu check executables commands on the host running the Sensu agent using a configuration management provisioning step, you can make use of Sensu dynamic runtime assets, and have the needed check command executables downloaded the first time the executable is run on a host by the Sensu agent.

Made with #monitoringlove by SensuTM in Canada 🇨🇦 and the USA 🇺🇸. © 2017-2021 – Privacy Statement – Terms & Conditions