Oh man, did I get ahead of myself in my last post! I started chatting tools, and I realize now that I really should have been talking more about why I’m using Sensu and Gremlin. But it didn’t occur to me until last year at Monitorama.

John Allspaw gave the keynote talk (Taking Human Performance Seriously). While you can watch the talk here, I’ll highlight a few points:
- People will pursue what they think will be productive, and won’t pursue that which they feel isn’t productive
- Monitoring & observability are inextricably linked with other activities
- Ask and develop better questions when doing incident analysis
- Disagreements are data
- Incidents are investments that your organization accidentally made
There are a ton of other great points that John makes. Please, take a few minutes and give it a listen. (Looking for more Monitorama goodness? My coworker Nikki Attea wrote an excellent recap of last year’s event, which you can read here.)
Ok, so what does all of that mean and what does it have to do with chaos engineering experiments and monitoring? Everything! When you consider what happens with an incident, the last thing anyone wants is more monitoring noise, or to be surprised by the information they receive. It’s not useful.
The tools we use when making sense of an incident should provide us with information in such a way that our reasoning about and making inferences during an incident are better because of that information. Informational cruft (i.e., contextless, repeated, action-less alerts) ultimately do damage, or at the very least don’t contribute to making sense of an incident.
This is why I’m using Sensu and Gremlin to refine the tool that I use for monitoring so that the information I have is of high quality and is a useful part of my information gathering and sense-making processes.
The rest of this series is going to focus on making Sensu a high-quality information gathering and sense-making tool for incidents. Not that it isn’t already a great tool, but just slapping a status check on a group of boxen doesn’t 👏 make 👏 for 👏 useful 👏 monitoring! There’s more to effective monitoring than metric gathering and status checks. So we’re going to work through that, going from the most minimal thing we can do (a status check, just so we have someplace to start) to an alert that provides us with high-quality information for future troubleshooting. We’ll use Gremlin along the way as a means of refining those alerts.
Let’s start out with the basics: a status check. I know, I know. “But you just said that a status check doesn’t make for useful monitoring!” Exactly, but we need to start somewhere. The whole point is to get a check in place and then refine it.
If you’ve not used Sensu before, a lot of folks start with system checks (CPU, disk, RAM). Let’s start with a CPU status check.
Starting Point: A CPU Check
Before we get started creating our check, I’ll assume that you’re familiar with Sensu’s core concepts and operating Sensu. If you’re just getting started with Sensu, you’ll want to head over to our interactive tutorial that walks you through the basics of operating a Sensu deployment and introduces the concepts that I’ll build on in this post.
With that out of the way, let’s get started by creating our check. We’re going to use a CPU check plugin found on Bonsai, Sensu’s asset index. If you’re using Sensu Go 5.13 or later, you can install it by running: sensuctl asset add asachs01/sensu-go-cpu-check, which you can verify by running sensuctl asset list.
Now we need to create our CPU check. You can use the example check definition below:
type: CheckConfig
api_version: core/v2
metadata:
  name: sensu-go-cpu-check
  namespace: CHANGEME
spec:
  command: sensu-go-cpu-check -w 80 -c 95
  runtime_assets:
  - sensu-go-cpu-check
  interval: 60
  publish: true
  output_metric_format: nagios_perfdata
  output_metric_handlers:
  - infuxdb
  handlers:
  - slack
  subscriptions:
  - system
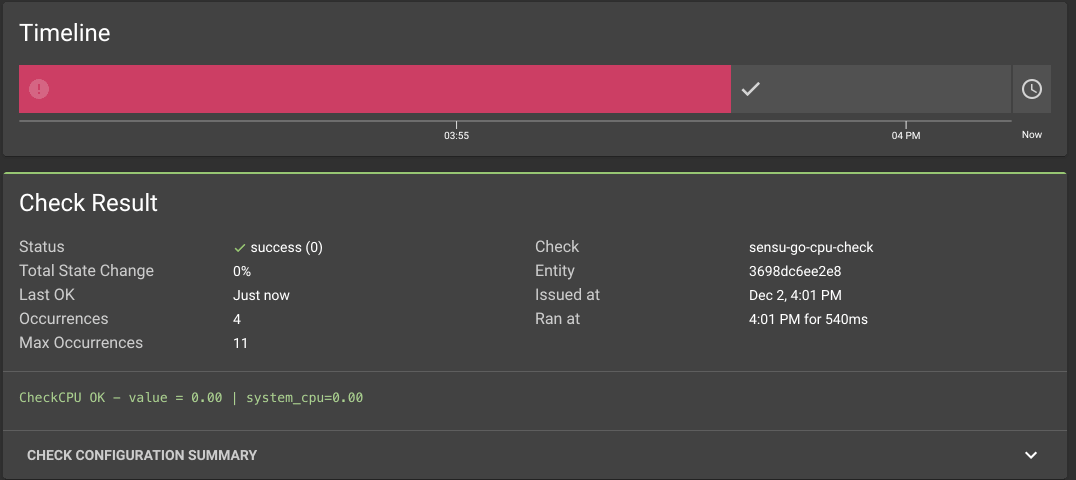
Copy the definition into a file called cpu-check.yml and create the check using sensuctl create -f check-cpu.yml:
We can then see it in the Sensu web UI:
There we have it! This is the first step to refining our checks into useful tools for human operators. In the next post, I’ll go over how we can use Gremlin to force this check to fail and how we can use labels and annotations on our checks to start enhancing the information our checks generate.
Related Posts

Chaos engineering + monitoring, part 1: Sensu + Gremlin
In this post, Sensu Customer Reliability Engineer Aaron Sachs gives an overview of Sensu and Gremlin and how they work together to create actionable alerts.

Filters: valves for the Sensu Observability Pipeline
Using JavaScript filters to express business logic in Observability Pipelines for hybrid cloud monitoring

Alert fatigue, part 5: fine-tuning & silencing
In part 5 of this series, Community Maintainer Ben Abrams dives deeper into fine tuning Sensu, including how to configure flap detection, silencing, and Safe Mode, as well as extending handler configurations. Read on to learn how.

Made with #monitoringlove by SensuTM in Canada 🇨🇦 and the USA 🇺🇸. © 2017-2021 – Privacy Statement – Terms & Conditions