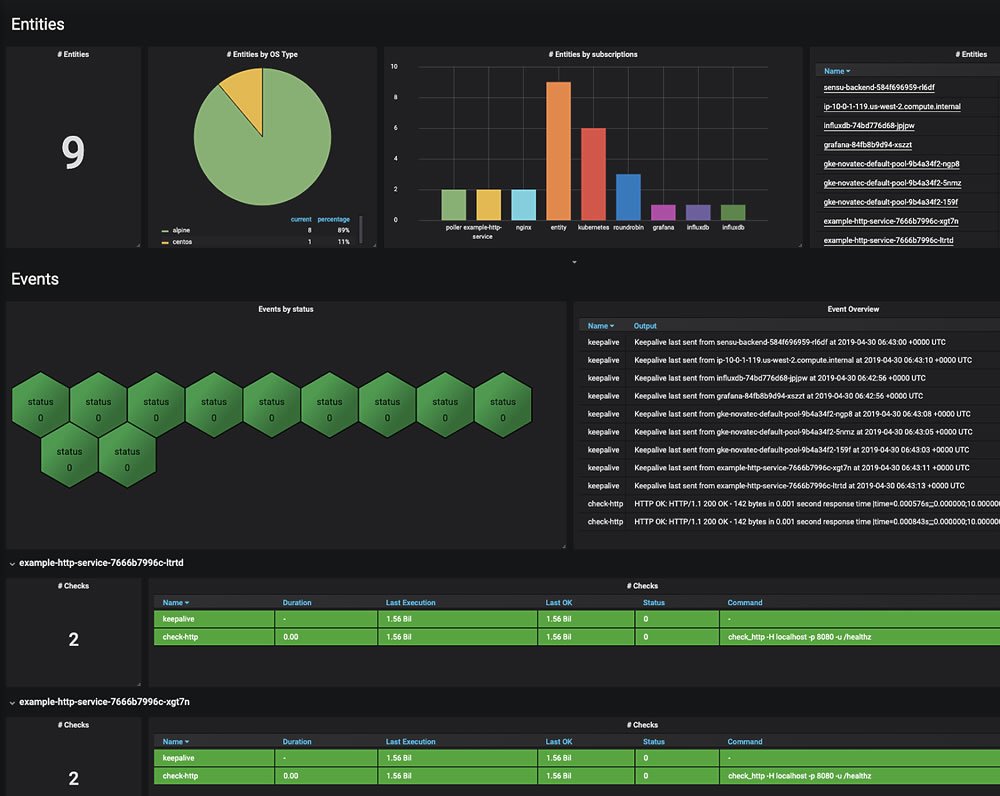
This is a guest post to the Sensu Blog by Chris Chandler, member to the Sensu community. He offered to share his experience as a user in his own words, which you can do too by emailing community@sensu.io. Learn all about the community at sensuapp.org/community.

{ Note: Based on comments from the Sensu Community, on 02/13/2018 I added Grafana to the “Some Sensu Dashboarding Options” section }
Introduction
Like many other Monitoring Nerds™, I started off using Nagios, and it served me well. But as we grew, matured, started Deving some Ops, I found myself looking for alternatives. My search ultimately ended with Sensu.
While getting into all of those is more of a book than a blog post, one of the key factors was Sensu’s API-first design — and all of the greatness that this design enabled. A prime example of that can be shown via how many users will interact with Sensu: Dashboards.
Sensu: An Overview
Before I get into some examples of dashboarding for Sensu, it is worthwhile to take a brief detour to talk a bit about Sensu itself. One of the things that made me a fan of Sensu is that was designed with the 12 Factor App principles in mind. It ticks all of the buzzword boxes — but not just for the sake of Marketecture.
Getting into all of the guts of Sensu is best saved for another post, but here are a few key callouts:
- Sensu is a monitoring framework, not a monolithic “product”
- Ultimately, it’s an event router and handler (though that truly sells short what it’s capable of)
- Config can be defined server-side, client-side, or a mix
- Config is managed as JSON, which is easily managed by Configuration Management tools (e.g.: Ansible, Chef, Puppet, SaltStack)
- There are a ton of community-provided checks, but you can very easily create your own (and even reuse Nagios checks)
- Keeping with the 12 Factor goodness, clients, check results, etc stored in Redis, which allows the Server-side processes to be stateless
- Also 12 Factor-y, there are separate services for processing and handling checks (
sensu-server) and serving up an API to perform CRUD operations on the state data in Redis (sensu-api)
It is important to note that these APIs were not a bolt-on; Sensu was built from the beginning with the expectation that viewing and managing event state would only be done via these APIs. Perhaps most importantly, the APIs are all public and fully documented, not locked away only for internal use.
Some Sensu Dashboarding Options
Because of these APIs, we have flexibility not only in our choice in dashboard, but also how Sensu deployments can be grouped in those dashboards. This will become plain as we talk about some dashboarding options available to us as Sensu users.
Uchiwa Far and away, the most commonly Sensu dashboard is Uchiwa. It is Community-provided, yet maintained by Sensu, Inc. as part of the overall Sensu project.
Uchiwa provides the things you would expect from a monitoring dashboard, including, but not limited to:
- List view of all current events
- List view of all clients (monitored entities, like servers, services, etc)
- The ability to drill-down into these items to get more info
- Acknowledge/silence/resolve events
All of these happen through Sensu’s APIs. For example, this screen in Uchiwa…

… is simply calling the /clients API behind the scenes, similar to this:
Uchiwa’s Datacenter Paradigm
Each Sensu deployment is comprised of 1 (or more) sensu-server process(es), 1 (or more) sensu-api process(es), and their dependencies (namely: RabbitMQ and Redis, which may or may not be shared across Sensu deployments).
For many customers, it makes sense to have more than one Sensu deployment. Some teams might have separate Sensu deployments for Dev vs Stage vs Production. Others might deploy a dedicated Sensu setup per Development team, allowing each Dev team to control all aspects of their monitoring independently.
While you can deploy a separate Uchiwa server (or servers) per Sensu deployment, often it is preferred to have a single view into all of these Sensu deployments, all in the same Uchiwa. To manage this, Uchiwa implements a concept of a “Datacenter.”
In Uchiwa parlance, a Datacenter is simply just a group of Sensu API endpoints. If it helps, when you see “Datacenter” in Uchiwa, you can think, “Sensu cluster.” The mapping of Sensu API endpoint(s) to Datacenters lives in the Uchiwa configuration.
The Uchiwa documentation provides a simple example. Here, we have two Sensu API endpoints that live under a Datacenter called “sensu”:
Later on, we will show a more interesting real-life, multi-datacenter example.
Sensu Enterprise
Sensu follows an “Open Core” model where anyone is free to deploy the Open Source version of Sensu and Uchiwa, with others preferring to buy Enterprise licenses for enhanced support and expanded, pre-built features that provide a more “batteries included” approach. One of the benefits of purchasing Enterprise licenses is the Sensu Enterprise dashboard.
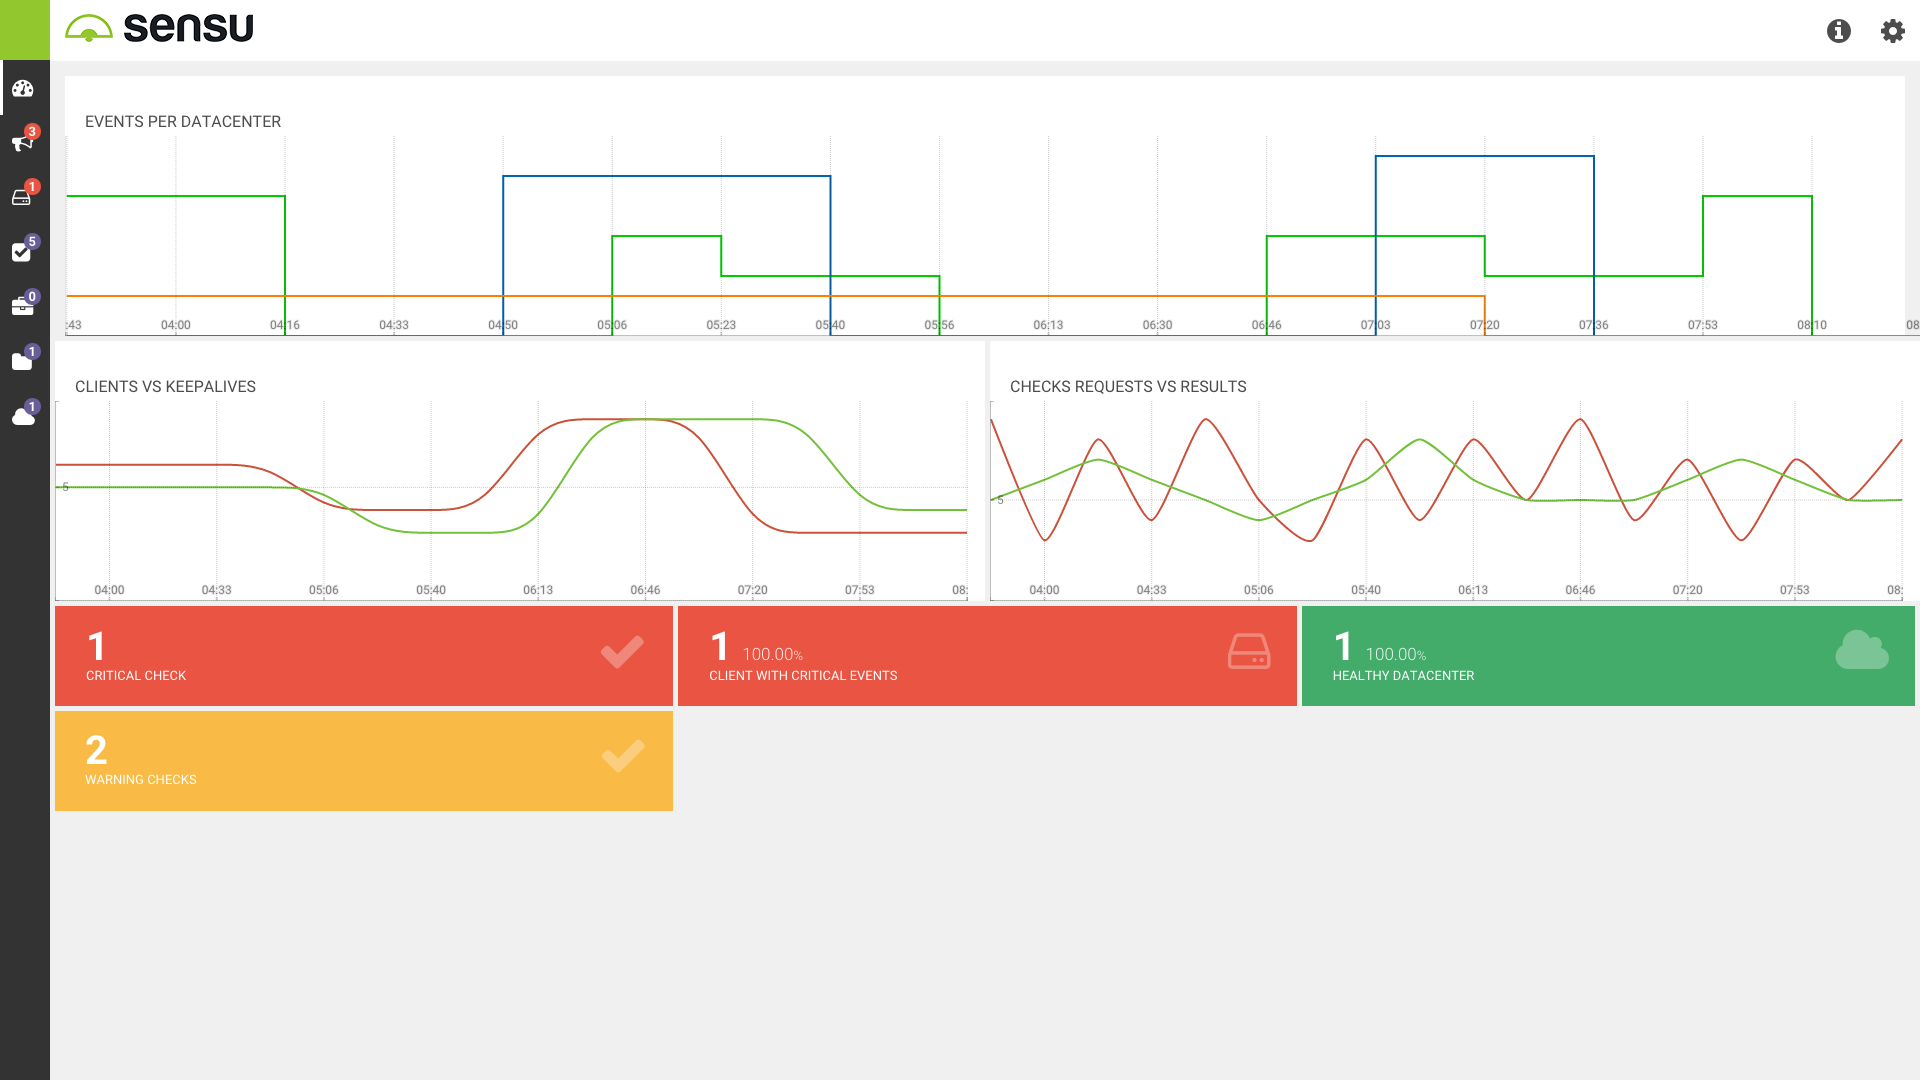
Think of Sensu Enterprise as an extended, customized version of Uchiwa. While getting into Sensu Enterprise’s features is outside the scope of this post, the key takeaway is that it uses the exact same APIs as Uchiwa.
Grafana
Yes, that Grafana. There is a Sensu datasource for Grafana, thanks to those awesome Sensu APIs. This means you can display Sensu clients, checks events and results, aggregates, etc in Grafana.
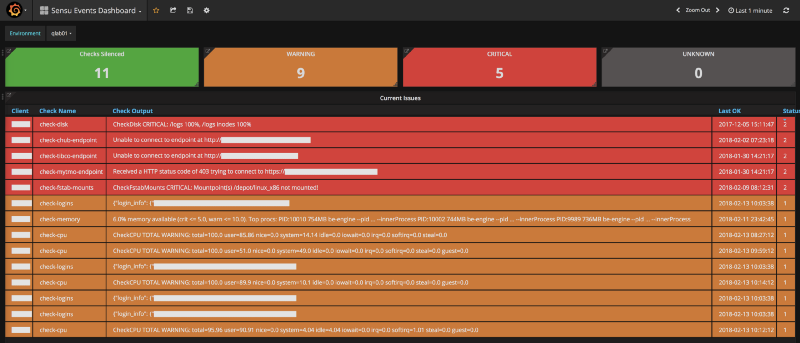
Here’s an example of an environment-wide view of events shown in Grafana:
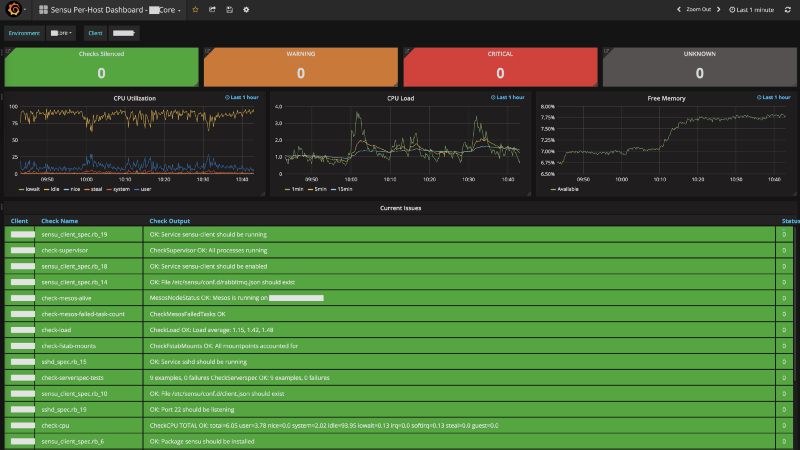
Similarly, we can provide a per-host view:

We can leverage Grafana’s built-in capabilities to provide dynamic drill-downs to link either from one Grafana dashboard to another (e.g.: from the Environment-wide view down to the per-host view) or even out to a completely different web UI (e.g.: from the per-host view to the equivalent view in Uchiwa).
When you consider that you can layer in any other datasources Grafana supports, this makes for some interesting dashboarding possibilities. Here is an enhanced version of the above dashboard with Telegraf-sourced OS metrics added to provide extra context of the host’s health:
Sensu Grid
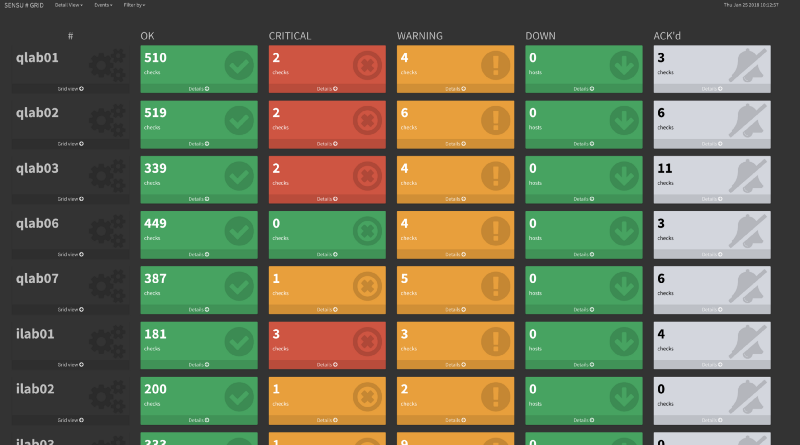
A prime example of how Sensu’s APIs can be used to build a dashboard to suit your particular needs is Sensu Grid. While Uchiwa provides a great list view of clients and events, there are some scenarios you might want a higher-level, summarized view of what is happening. That is what Sensu Grid aims to provide, and it does it all using — you guessed it — the same APIs as Uchiwa and Sensu Enterprise.
More details will be provided in the next section, but here is a screenshot to whet your appetite:
Deployment Example: Multiple Environments, Multiple View Options
Now that we have a baseline understanding of Uchiwa, Sensu’s APIs, and how those things relate to each other, let’s get into a real-world example of how we currently use two of the dashboards mentioned above: Uchiwa and Sensu Grid.
Multi-Datacenter Uchiwa: One Dashboard to Rule Them All
For reasons I will spare you the details of, we have many pre-production environments. These environments need to be viewed holistically as a unit. Because of this, we have a Sensu deployment for each environment (as opposed to by service, by Development team, etc).
While we have an Uchiwa per environment so deployments can se self-contained, we also deploy an “Uber” Uchiwa that allows us to see all environments at once. Not only does this make things simpler (one URL to remember versus one per environment), but we can also quickly drill-down to a given environment with a quick click in the Uchiwa UI.
Before we show this in action, we can click the bottom icon in Uchiwa’s left-side menu to show the list of configured Datacenters. This view also shows the version of sensu-api is running, whether it is connected to Redis and RabbitMQ, the number of events, clients, and other information specific to that Sensu deployment.
This is what that list looks like in our deployment:

Here is the entire Uchiwa config file (with some redaction, of course) that makes this possible:
As mentioned above, with the config being simple JSON, we can use our Configuration Management tool of choice to quickly update and manage this configuration.
Having all of these Sensu deployments in Uchiwa’s config allows us to see a unified view of all clients and all checks across all of these environments… all in one page.
With apologies for some redaction, here is what this looks like in my deployment:
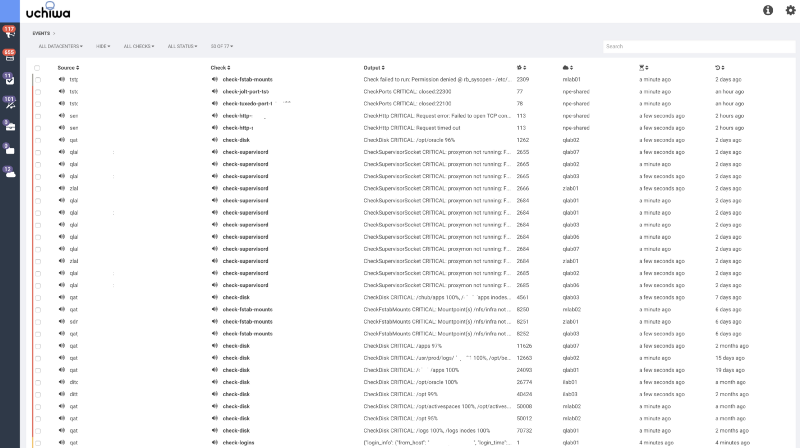
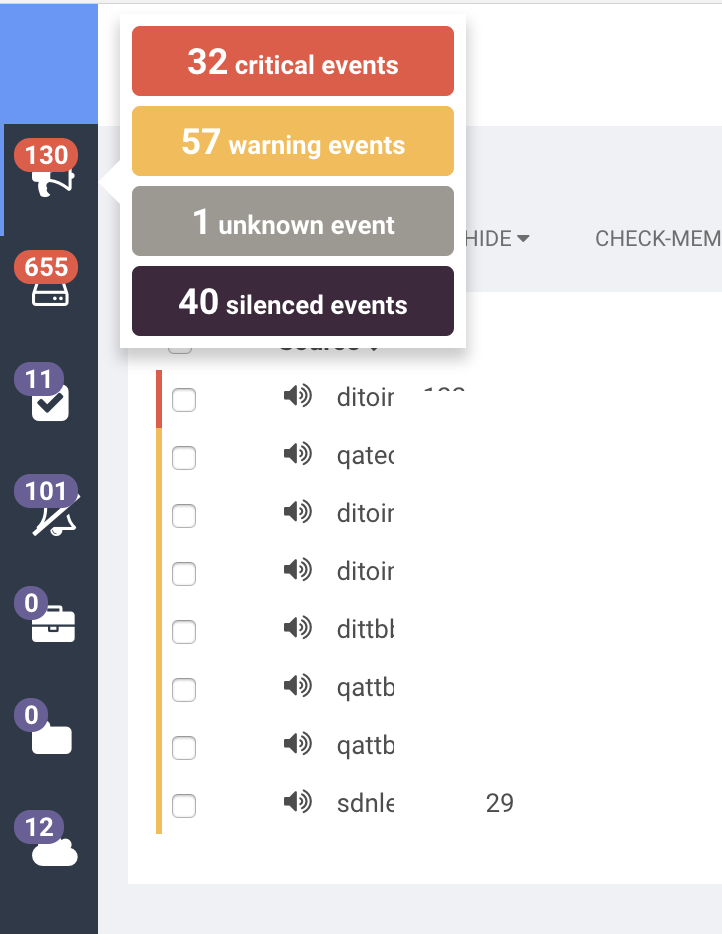
Those scary numbers you see on the top-left are the number of checks in a non-OK status (117) and the total number of clients (655). I did mention this is non-production, right? :)
Hovering over these numbers, we can get a pop-out with the breakdown of check states. The same applies to clients.
And where does all of this data come from? Say it with me: “Sensu’s APIs!”
Sometimes we need to look at just a given environment, rather than the deluge of stuff across all environments. That is as simple as clicking the “Datacenter” drop-down in the upper left, then choosing the environment.
Better yet, I can combine Uchiwa’s ability to group events by check name in conjunction with the Datacenter drop-down.
As an example, if I suspected that there might be issues with free memory on servers in a given environment, I can click the “All Checks” drop-down to see a list of checks that Uchiwa has discovered from, well, you know where…. Sensu’s APIs.
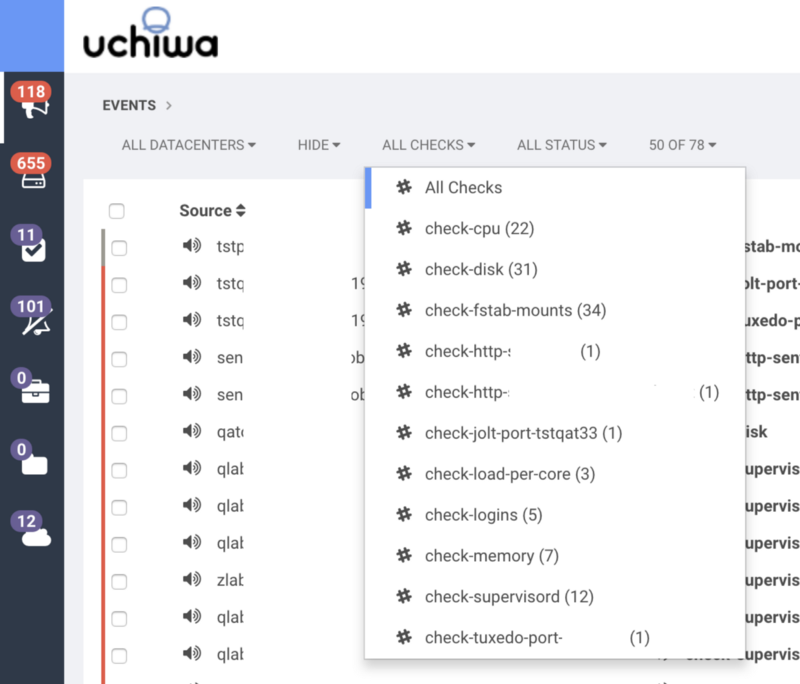
By choosing the “Check Memory” check, my world view goes from seeing all events…
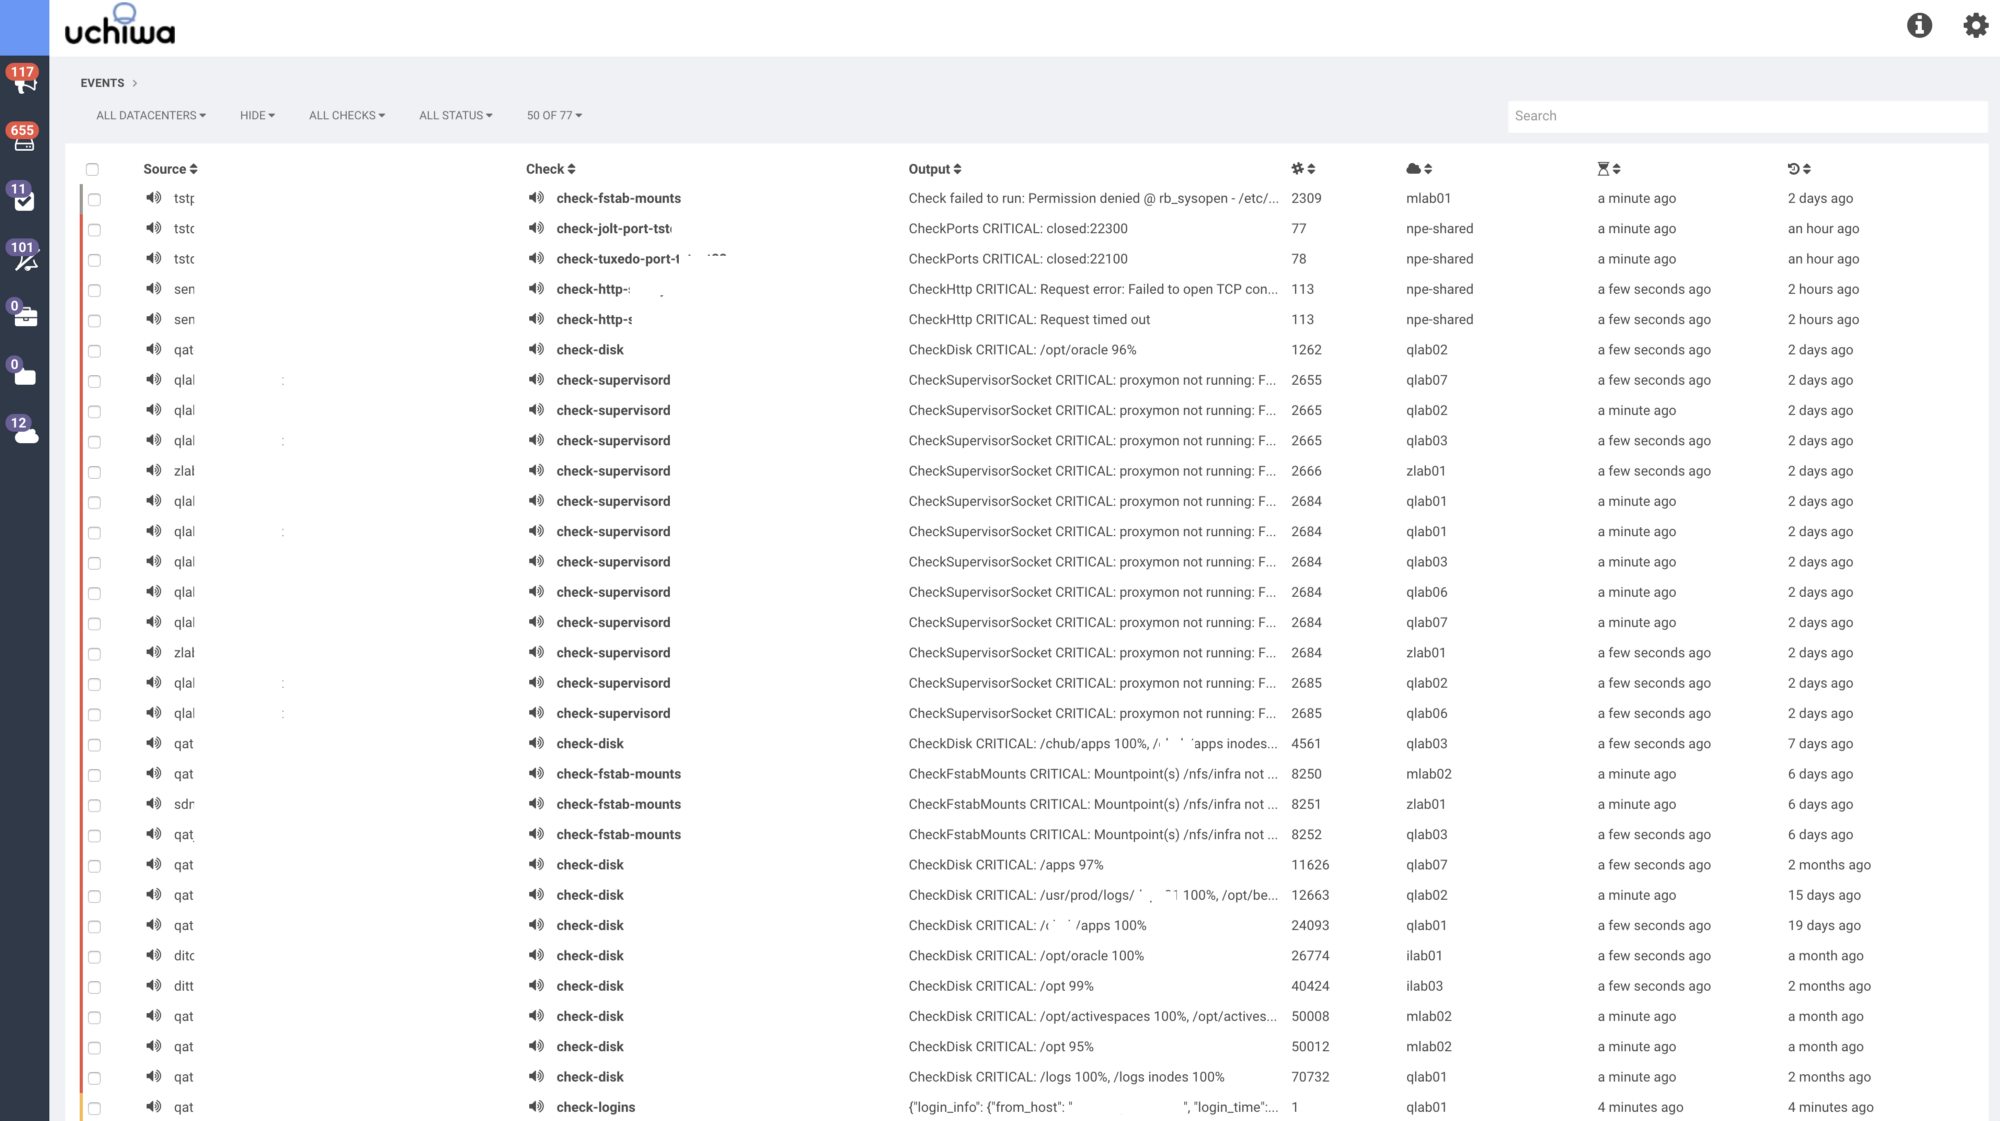
… to just the events triggered by failing Check Memory checks:

I can further refine this by clicking the “Datacenter” drop down and choosing a specific Datacenter (AKA: Sensu deployment), such as ILAB03…
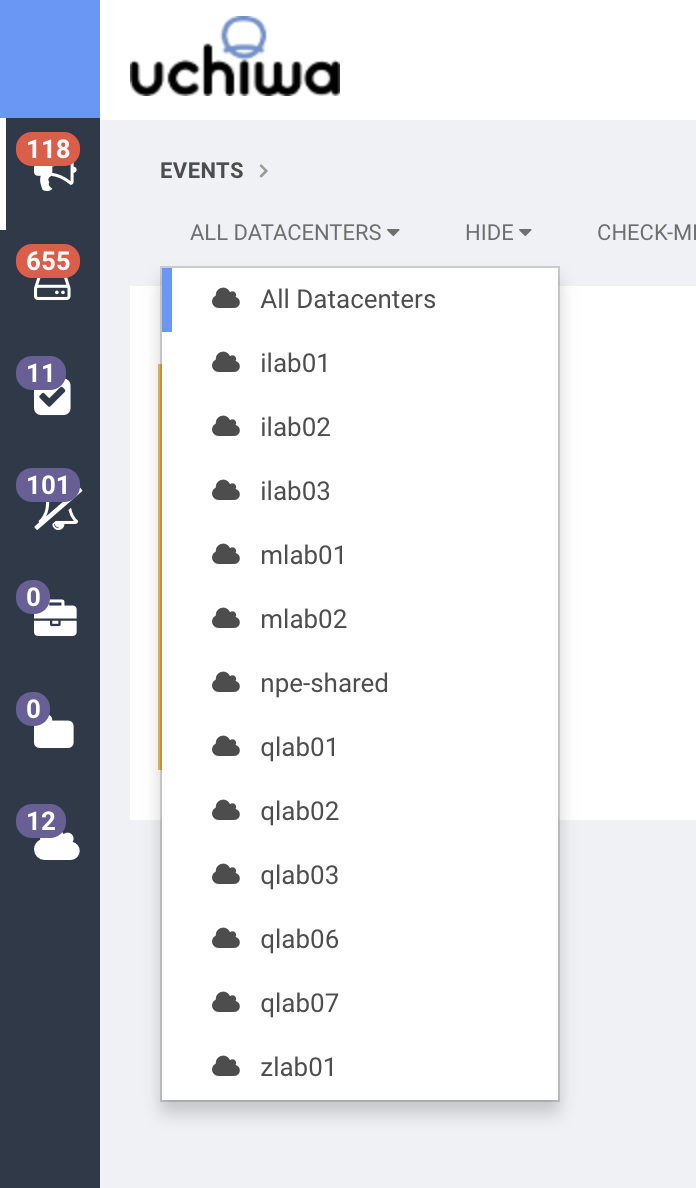
… which updates my view thusly:
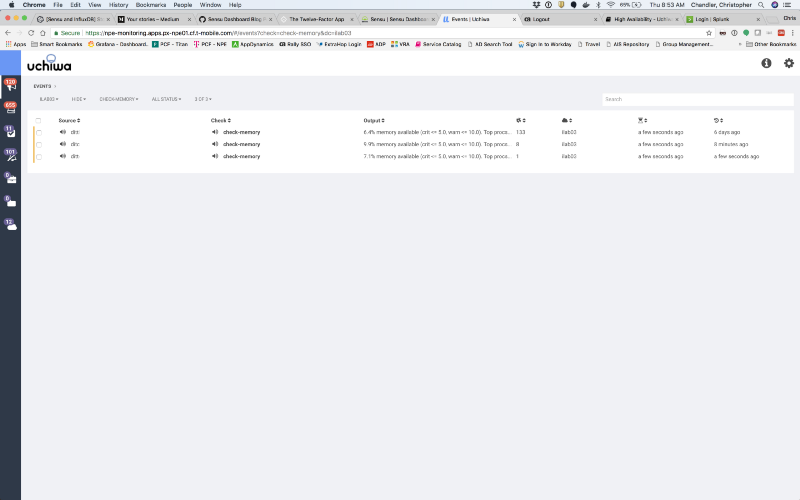
And if I want to view these events in the context of all events for this Datacenter, I can go back to the “All Checks” drop-down and choose “All Checks” to see all events for this Datacenter:

Sensu Grid: A Monitor/Executive-Friendly View
While Uchiwa is great for folks responding to and investigating events, there are times where you just need what I call a “chicklet”-based view of the world; boxes with a high-level summary that helps me quickly assess how things are going. This works well for wall-mounted monitors in a Support Center or simply to provide a more Executive-friendly dashboard where deep detail would be inappropriate.
For these reasons, and I am sure many others, Alex Leonhardt created Sensu Grid. This is a completely home-grown project and is a perfect example of how anyone can build a custom dashboard for Sensu if the existing ones do not suit their needs — and even have these dashboards complement each other.
Sensu Grid shows much of the same data that Uchiwa does, but displays it in a more summarized fashion. Like Uchiwa, it gets this data from the same suite of Sensu APIs, and it also supports a multi-Datacenter paradigm.

You can choose to drill-down to see all events for a given Datacenter. Here, we see events for ILAB03, which is the same environment we looked at in our “Check Memory” example in the Uchiwa section above. It is the same data, just with a different presentation.
Even better, clicking the “Detail” link on any of these boxes takes us to the page in Uchiwa for that check on that client. So, we can have the best of both worlds, “Two great tastes…”, etc.

There is also a per-client view that shows:
- A summary with the number of events triggered on that client
- Green/Yellow/Red background indicate the highest-severity event happening on that client
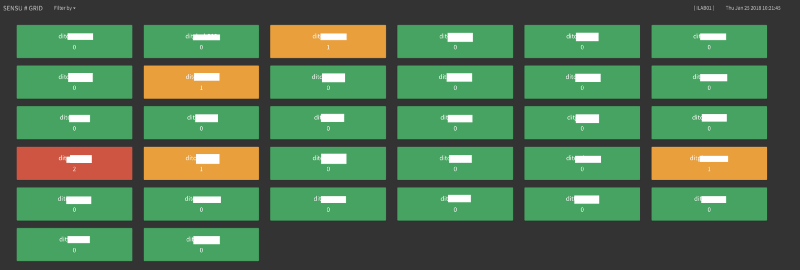
With the “Details” drill-downs in Sensu Grid sending you to the appropriate page in Uchiwa, it is very easy to go from a macro-level view of one or more Datacenters into a micro-level view of a specific client or check.
Conclusion: Aren’t Open APIs Awesome?
I am sure you are sick of hearing it by now, but hopefully you agree that without Sensu’s open, robust APIs, none of this dashboard-y goodness would be available. Having this all be Open Source also means we are free to use, extend, and even create anew. Like everything else with Sensu, there is a rich foundation of existing solutions to common problems, yet it is built with an openness and composability that allows people to extend and improve upon those foundations to suit their individual needs. Dashboards are just one example of this.
It is this spirit of extensibility, openness, and community that first endeared me to Sensu — and it is what keeps me loyal to it today.
This is a guest post to the Sensu Blog by Chris Chandler, member to the Sensu community. He offered to share his experience as a user in his own words, which you can do too by emailing community@sensu.io.

