Your registration has been confirmed. Thank you for signing up!
The differences between Sensu & Prometheus for monitoring multi-cloud, ephemeral infrastructure.
![[Whitepaper] Sensu & Prometheus](http://images.ctfassets.net/w1bd7cq683kz/2Svb5No2L0vPrMymxLRsm7/e61c2d0f362fb66b1926a0ae13f46c5b/-Whitepaper-_Sensu___Prometheus.png)
Prometheus is an open-source systems monitoring and alerting toolkit originally built at SoundCloud. It is now a standalone open source project and maintained independently of any company. It has a multi-dimensional data model with time-series data identified by metric name and key/value pairs. Targets are discovered via service discovery or static configuration, and collection happens via a pull model over HTTP.
With Prometheus’ collection of client libraries for various programming languages, you can publish metrics so they can then be scraped by the metrics server. Prometheus is an excellent solution for monitoring using metrics.
Sensu has a more flexible data model, which allows for time-series metrics, status, tracing, and any other JSON-encapsulated data. It has a pub-sub model with agents that automatically establish an encrypted session to the Sensu backend and downloads its operational files as needed. Also, Sensu has key DevOps and enterprise features such as monitoring as code and business service monitoring (BSM), all of which reduce the opex in large ephemeral environments.
The fact that Prometheus’ data model defaults to “purely numeric time series” data presents a double-edged sword: on the one hand, you can easily standardize collecting data in a particular way, which helps simplify things; on the other, you’ve now limited yourself to a constrained collection methodology and data model that might be missing some context.
As with any pure-telemetry monitoring solution, you miss out on context with the simplified, constrained data model. Because all data must be represented as a measurement, it affects how you represent certain pieces of data. For example, trying to check if a port or a service is available or a pattern match in a log file does not fit into the telemetry monitoring model.
Prometheus is a powerful tool for collecting telemetry data, but it relies heavily on collection performed by Prometheus Exporters. Exporters can be embedded Prometheus clients in proprietary and COTS applications, or standalone processes that are effectively single-purpose monitoring agents. It’s not uncommon for hosts running multiple services to have a half dozen or more of these single-purpose agents installed on a single compute instance! To collect telemetry data, Prometheus service “scrape” metrics from these endpoints (via HTTP GET). Support for collecting metrics using other methodologies is limited or incompatible. While this export/scrape method of metrics collection is very simple to reason about (a unified metrics collection strategy), it can require significant effort to deploy at scale, and create friction with teams who have invested in other instrumentation techniques (e.g., custom monitoring scripts, Nagios-style plugins, StatsD, etc).
Prometheus and AlertManager were designed for collecting and basic alerting on telemetry data, but modern operations teams have developed sophisticated operational requirements that extend well beyond simple alerts. Enterprise IT organizations that adopt DevOps and SRE practices need tooling for integrating monitoring and observability tools with the rest of the multi-cloud toolkit. For example, Prometheus lacks first-class APIs for inventory or endpoint management (needed for integration with CMDBs), and AlertManager does not support the complex event processing capabilities needed to implement self-healing infrastructure (automated remediation).
As the second most mature open source software project after Kubernetes in the Cloud Native Computing Foundation, there’s no doubt that Prometheus is an excellent tool for monitoring the Kubernetes platform and applications that are optimized for cloud-native operations. Organizations that have moved 100% of their workloads to Kubernetes will be more successful with Prometheus than those who are in the early stages of that journey, or who have realized that not all workflows are a good fit for cloud native platforms. Why? The very nature of Prometheus’ own optimization for Kubernetes makes it more cumbersome in traditional compute environments (e.g., private cloud). Discovery and collection mechanisms that “just work” in Kubernetes – because they were designed specifically for Kubernetes – are less reliable if not incompatible with traditional enterprise environments that use NATs and VPNs. Discovery mechanisms also vary from one cloud platform to another, which increases overall operational complexity.
Prometheus relies heavily on polling HTTP endpoints to collect telemetry data, inevitably requiring open ports in firewalls. Because Prometheus exporters are also roughly equivalent to single-purpose agents, this requires one open port per exporter (e.g., to collect host metrics and database telemetry on a database server would require two ports to be opened). This design does present a larger and more complex surface area to manage from a security perspective. Recent enhancements to Prometheus have added support for TLS encrypted data collection, however encryption must also be implemented & configured on each individual exporter for this to work. From a security perspective, this represents a fairly significant risk exposure as each individual exporter implements its own HTTP server, making security audits nearly impossible due to the large surface area of third-party code to review.
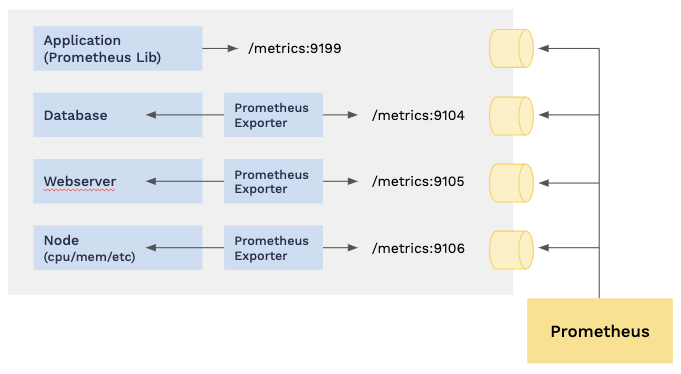 Figure 1: Native Prometheus monitoring requires external port access.
Prometheus federation, HTTP proxy middleware, and other techniques can help mitigate these risks, but they also add layers of abstraction and complexity in a mission-critical capacity.
Sensu and Prometheus take two very different approaches to monitoring. Sensu can be used with Prometheus or as an alternative, depending on your needs. The Sensu Go platform provides superior flexibility, generally making it a better choice for established companies with diverse organizational and technical requirements.
There’s more to monitoring than just metrics. As much as we may wish to turn things into measurable goals, not every facet of a complex distributed system’s health can be represented as a number. Sensu overcomes limitations of a purely metrics-oriented solution with an extensible data model. Sensu uses structured data that support high cardinality observations including key-value metadata (labels and annotations), rich service health status information, and raw metrics (not pre-aggregated).
Standardization is a double edged sword. When adopted universally, standardization can have a big impact – but in most organizations, it can become cost prohibitive even at moderate scale. Replacing existing solutions and rewriting applications in the name of standardization has very real costs without a guaranteed value proposition. Sensu delivers all the benefits of standardization without the high adoption costs by fully supporting thousands of existing data sources and collection mechanisms, including: Prometheus metrics + exporters, StatsD metrics (Sensu agents have a built-in StatsD daemon), Telegraf metrics + agent, Zabbix- and Nagios-style plugins and check scripts + PerfData, and even SNMP traps.
Sensu breathes new life into existing instrumentation by enriching collected metrics (e.g., by adding custom metadata), and consolidating disparate data sources into a unified observability pipeline.
The Sensu solution has been battle tested in industry leading Fortune-100 IT environments with tens of thousands of systems under management. Sensu provides a robust operations platform that eliminates noise and helps identify root cause. From event deduplication and correlation, to acknowledgment and suppression of alarms, automated diagnosis and remediation, and integration with other operational systems of record such as ServiceNow, PagerDuty, JIRA ServiceDesk, and many more.
Problem detection is only the first step in an effective monitoring strategy. Once performance degradations or system failures are detected, we must take action – but those actions aren’t always just alerts. Sensu’s observability pipeline provides powerful and extensible solutions for automating workflows, including collecting additional context, automated remediation and CMDB registration on discovery of new nodes/endpoints, and many more. Reserve alerts for tasks that operators can’t automate.
You can scrape Prometheus endpoints and further enrich the telemetry data with additional system metadata using Sensu (i.e., all the information about the system your Sensu agent is running on). With more fields and more context, you’ll be able to compose more complex queries later.
Sensu provides a single monitoring agent, allowing you to collect monitoring data in a variety of ways, as opposed to choosing a single method of collection. With Sensu, you get Prometheus endpoint scraping, service checks, and first-class APIs. Sensu fits perfectly within multiple monitoring instrumentation ecosystems — you can take advantage of the Prometheus instrumentation libraries while processing and storing it in the database of your choosing, like InfluxDB, Elastic, or Splunk. Sensu can utilize all your existing Nagios and Zabbix plugins seamlessly.
Sensu supports and uses industry standard TLS encryption for communications between the agent and the backend. The backend supports role-based access control to the data as well as multi-tenancy, LDAP, AD, and SAML. Sensu’s push agent allows collecting and transmitting data securely over complex networks without having to compromise firewalls.
Sensu complements Prometheus while giving you additional context from events, health checks (i.e., not just metrics), more comprehensive capabilities around processing monitoring data as a workflow (i.e., Sensu handlers can do a lot more than just alerts), and a secure solution.
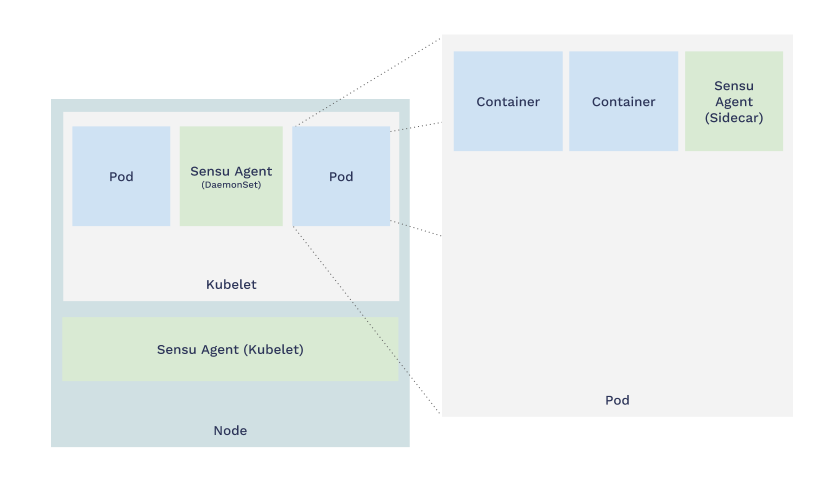 Figure 2: Deploying Sensu as a Kubernetes sidecar.
Sensu agents are most commonly deployed as Kubernetes sidecars (one agent per Kubernetes pod), or as a Kubernetes daemonset (one agent per kubelet/node).
The Sensu agent performs service health checks (i.e., generating event data) and collects telemetry data from a variety of sources, including Prometheus endpoints. The Sensu agent then provides a secure pubsub transport, transmitting event and telemetry data to the Sensu backend – easily traversing complex network topologies without punching holes in firewalls.
The Sensu backend provides a horizontally scalable monitoring data processing solution that extends well beyond just sending alerts. Sensu processes data via event handlers, which can route metrics to your preferred data store (e.g., InfluxDB, Elasticsearch, etc), trigger automated remediation actions, or create and resolve tickets in PagerDuty or ServiceNow.
Ready to learn more? Check out the following resources:


Made with #monitoringlove by SensuTM in Canada 🇨🇦 and the USA 🇺🇸. © 2017-2021 – Privacy Statement – Terms & Conditions