The following is a guest post from Jean Tunis, the principal consultant and founder of RootPerformance.
You want implementations to be simple. Who doesn’t?
But often, that’s not the case.
SNMP is one of the oldest used protocols to manage a network. SNMP stands for simple network management protocol, but it might not have been all that simple for you.
Maybe it was simple back in the late 1980s, when SNMP became a standard protocol for network monitoring. But that was over 30 years ago, and while SNMP is ubiquitous, a lot has changed.
In this post, you’ll learn what SNMP is and some challenges you may have when using it to monitor your infrastructure. You’ll also learn some best practices you should consider when implementing SNMP monitoring.
Monitoring with SNMP
SNMP is an application-layer protocol consisting of a manager and an agent. The SNMP agent is software that many manufacturers implement in their devices to expose various performance statistics.
When enabled, the agent collects performance data about the device it’s running on and sends it to an SNMP manager, which can be software installed on a general-purpose computer or purpose-built device. It receives data the agent collects.
Communication between the manager and agent occurs over the UDP protocol.
Go to the polls and traps
The ways that SNMP helps you monitor your infrastructure are through polling and traps.
The first way is through polling.
The SNMP agent listens on UDP port 161, by default, for any SNMP GET requests from the manager. You configure the manager to synchronously poll the agent to send collected device data. Once it gets the request, the agent sends that data over UDP with an SNMP GET response.
The second way is through traps.
You configure the manager to listen on UDP port 162 by default for traps or alerts that the agent sends asynchronously. These traps can be CPU utilization that has all of a sudden jumped to 100 percent or a network connection that has just gone down. Either way, you want to know when something like that has happened. The SNMP agent will send a trap to the manager, and you in turn can get an alert of the issue to investigate.
An object identifier (OID) and a management information base (MIB)
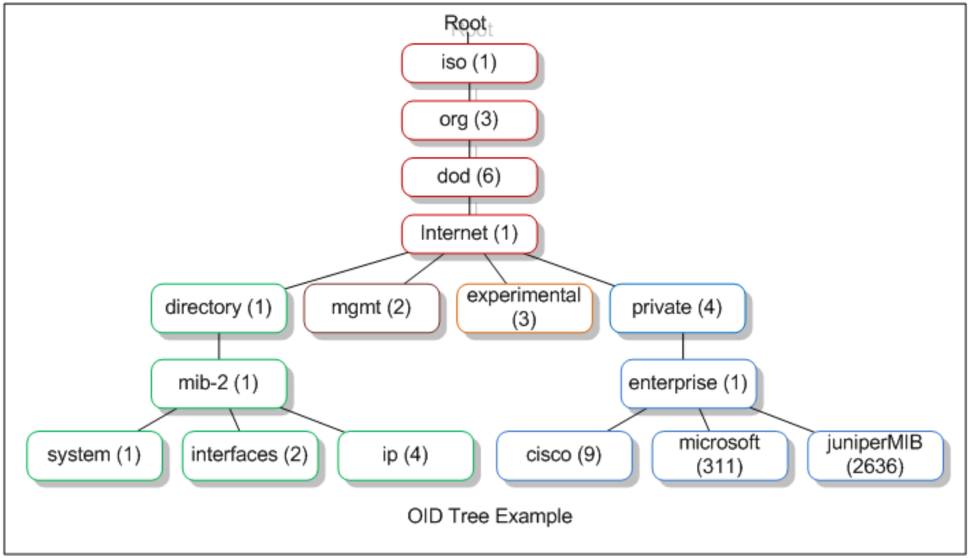
The data that the SNMP agent collects and sends to the manager can be many things, including CPU and memory use on your servers, interface status and traffic across your routers, and switchport queue length on your switches. Each piece of information is considered an object and is referenced using a unique object identifier (OID).
Each OID is a long string of digits, separated by dots, like an IP address. This is called dot notation.
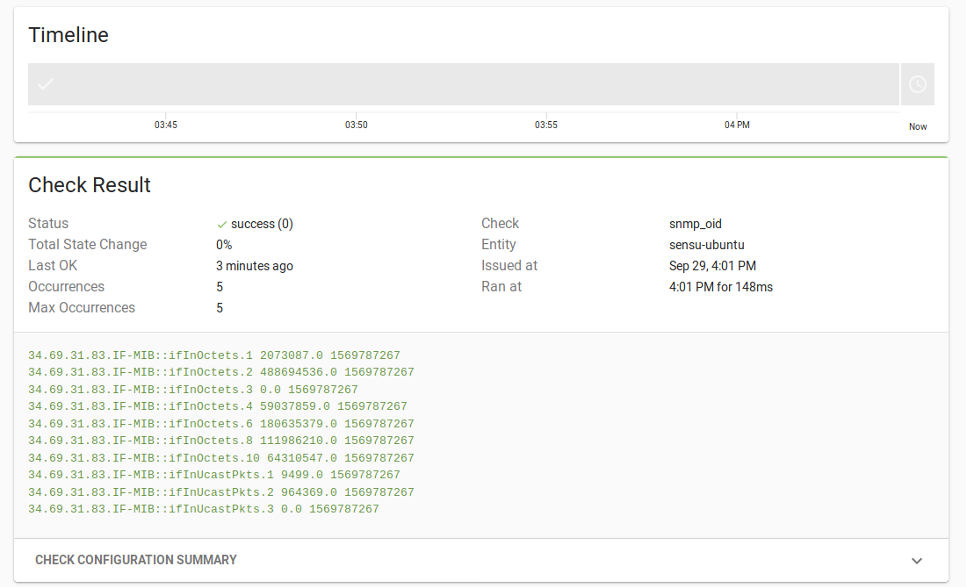
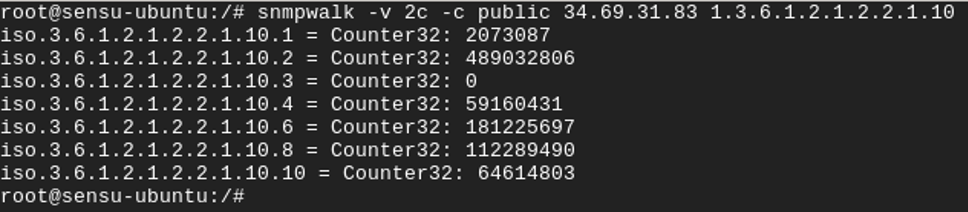
To see the number of bytes coming into one of your interfaces, you would query 1.3.6.1.2.1.2.2.1.10. This is the IfInOctets OID.

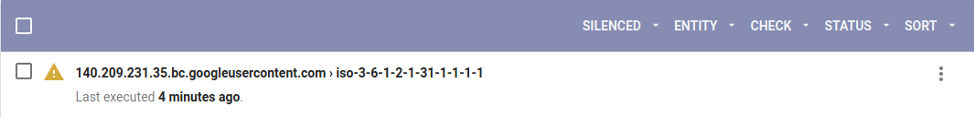
If you want to do more than just an snmpwalk, you can integrate SNMP data collection with a monitoring tool. Using Sensu Go as an example, you can use the sensu-plugins-snmp plugin to query SNMP devices you want to monitor. With this plugin, you can create a check that runs on a schedule to collect data.
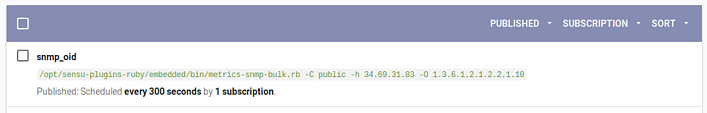
You can see the results of this check by going to the events generated when the SNMP query runs.
Each of these OIDs is organized hierarchically in a management information base (MIB).
The MIB is effectively a database of all the OIDs and their associated names and definitions. It forms a tree-like hierarchical structure that you must traverse to get the data you want for a particular object.
The SNMP standard defines “public” MIBs that each device should collect, such as network interfaces with the IF-MIB. You can get the IF-MIB of a device using the metrics-snmp-if.rb command from the Sensu SNMP plugin. There are also “private” MIBs that manufacturers can add to their implementation beyond the standard. This allows them to expose additional information about their devices that are useful in SNMP monitoring.
 Source: Wikimedia Commons
Alerting with traps
When you want to get notified of infrastructure issues, you can use SNMP’s trap capability. An SNMP-enabled device can notify your purpose-built device or monitoring software when certain metric thresholds are met or exceeded. Each manufacturer is likely to configure a trap differently. However, with your SNMP manager’s destination IP properly configured on your devices, you’ll be able to see where certain issues are occurring on your infrastructure.
Similar to snmpwalk, you can use the snmptrap command to test sending trap data to your SNMP manager. Here’s the command for SNMPv2:
snmptrap -v <snmp_version> -c <community_string> <destination_IP> <uptime> <OID_or_MIB> <object> <value_type> <value>
For example, to send a notification that the number of incoming bytes on a particular interface was a specific amount, you can run an OID-based query like the following:

Running the SNMP trap daemon (snmptrapd) in the foreground that’s listening on UDP port 162, by default, will let us see the trap as it’s being received.
Your SNMP-enabled device could be configured to send a trap each time a particular threshold has been exceeded. But you likely won’t be sitting in front of a Linux console watching snmptrapd for incoming traps to know this.
Your infrastructure also likely contains many more devices to monitor. So you will need some monitoring solution to receive and view all your device traps. If so, you could set up something like Sensu’s snmptrapd2sensu utility. With this, you’d be able to have Sensu act as a trap handler for snmptrapd. With snmptrapd2sensu, incoming traps are converted to Sensu events and are viewable in the web UI.
You can see the details of the trap by going to the received Sensu event.
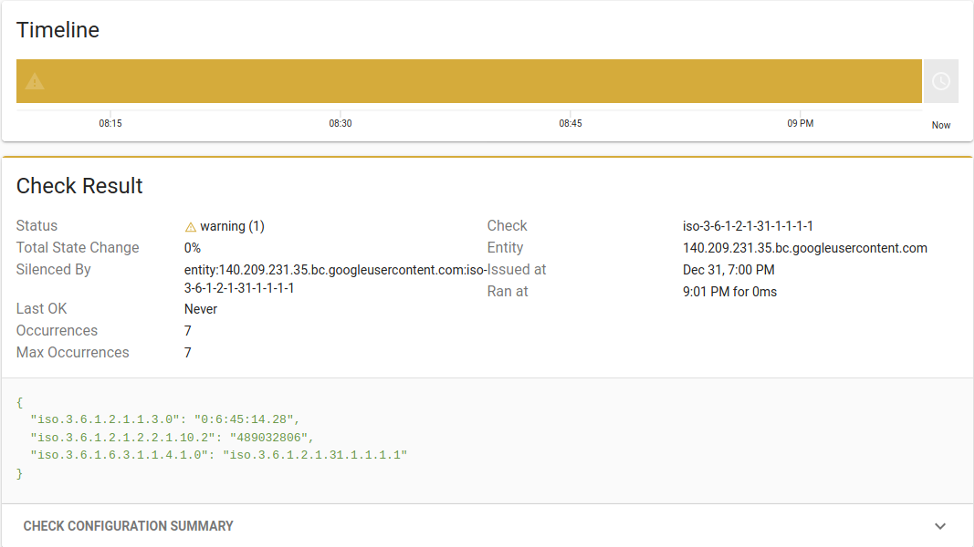
Once you have this trap data in a monitoring tool, like Sensu, you can do things such as generating alerts to ensure you’re aware of issues on your infrastructure. And with Sensu’s event pipeline, you can alert on real issues and avoid alert fatigue.
SNMPeeved
As with a lot of things when operating an infrastructure, implementing SNMP comes with many frustrating challenges. Let’s get into a couple of them.
Insecurity of SNMP
SNMP comes in three main versions: v1, v2c, and v3. Over the years, each version has been plagued with security issues because, at its most basic level, all you need to query an SNMP-enabled device is a community string. This is your password.
Not only is a single password insecure, v1 and v2c send it in cleartext — not very secure in today’s infrastructure.
To make things better, SNMPv3 introduced authentication with MD5 or SHA-1 and encryption with DES or AES. But it’s plagued by the fact that MD5 and SHA-1 are now considered insecure. While an RFC exists for SHA2 support, it seems many manufacturers have yet to fully implement it on their devices.
Low priority
The SNMP MIBs are vast, depending on the device. As a result, on many devices, SNMP is a low-priority process. What this means is that under heavy load, your SNMP queries get dropped. Also, when you configure SNMP traps, the device may not send them during extra load due to its low priority.
You can adjust the priority level in some devices to prevent this, but that may have adverse performance effects. So tread lightly here, and run tests first.
Vendors implement differently
While SNMP is a standard, its success is highly dependent on manufacturers’ implementation of the protocol. For reasons specific to their devices, some may choose to implement SNMP a little differently than the RFC.
This can lead to SNMP responding slowly. Or it can also lead to SNMP bringing down a device because you queried an unimplemented public MIB object. You want to be careful with where you enable SNMP. On highly available systems, you may want to think twice about enabling SNMP or make sure you’ve thoroughly tested how your devices behave under SNMP polling.
Consider this
When using SNMP to monitor your infrastructure, the challenges above are just a sample of the things to be aware of. There are several best practices to consider when implementing SNMP monitoring, including:
- Use different authentication and privileged passwords. To help minimize the chances of an incident due to the insecurity of MD5 and SHA-1, it’s recommended you utilize different passwords for authentication and encryption. Some organizations I’ve come across still use the same password for both. If you do this, you’re only setting yourself up for failure.
- Change default community strings. To make things “simple,” some operators just enable SNMP and start polling their devices. When you do this, you leave the default settings, which are often SNMPv2c and the read-only and read-write community strings. They are usually “public” and “private,” respectively. This is OK for testing, but in production, that’s just a recipe for disaster. Make sure you either enable SNMPv3, which forces you to create a username and password, or change the community strings from the defaults.
- Use complex strings. If you don’t want to use SNMPv3, it’s best practice to use complex community strings. Whatever rules your organization has for user passwords, use them for your strings as well. Make sure your strings include at least 20 characters and different types of characters, like numbers and letters.
- Use a separate management network. If possible, you should utilize a separate management subnet for your SNMP monitoring. I’ve often seen that SNMP is the dominant source of network traffic at some organizations. This can create unnecessary traffic that your infrastructure and users have to contend with. Don’t let SNMP traffic affect user performance. Using a separate management network provides the added benefit of shielding your data network from potential security risks as well.
- Use one tool for SNMP data collection. To minimize the impact on your devices, you should consider using only one tool to collect SNMP data. As mentioned above, SNMP can bring down a device. Some organizations use one tool for monitoring, another for configuration, and yet a third for asset management. This can be problematic. Not only can any one of those tools impact device performance, they could also introduce added security risks.
Go forth and simplify
Implementing and using SNMP may not be as simple as it was “back then.” But you need to know what’s in your infrastructure. Devices get added and removed probably every month, if not every day. You need to be able to know if something has been added that doesn’t belong.
That’s (very basically) what monitoring is — collecting information about what’s running on your network and how those things are doing. The SNMP protocol helps you get to that point. It may just be black box monitoring, but it’s better than no monitoring.
SNMP has been around for more than 30 years and probably isn’t going anywhere anytime soon. So go monitor with SNMP, use the ideas above to make your implementation simpler, and don’t get caught off guard by failing to monitor.
Have your own tips for SNMP simplification? Share them in our Community Forum, below!

Author bio:
Jean Tunis is the principal consultant and founder of RootPerformance, a performance engineering consultancy that helps technology operators minimize cost and lost productivity. He has worked in this space since 1999 with various companies, helping clients solve and plan for application and network performance issues.
Related Posts
How to monitor 1,000 network devices using Sensu Go and Ansible (in under 10 minutes)
In this post, Becon's Christian Michel covers a brief history of network monitoring tools — including the pain points of legacy technology when it came to monitoring thousands of devices — and shares his modern-day solution using Sensu Go and Ansible.

DevOps tools for compliance monitoring
Learn how you can align your compliance and monitoring efforts — automating manual processes where possible — with examples from Sensu and InSpec.
Observability Pipelines: Why you need one, and why you should stop rolling your own
Why you should be using Sensu’s observability pipeline — and why rolling your own solution from scratch is far too costly."> <meta name="generator

Made with #monitoringlove by SensuTM in Canada 🇨🇦 and the USA 🇺🇸. © 2017-2021 – Privacy Statement – Terms & Conditions