Over the last 10 years, the landscape that we manage, maintain, and control as operators and developers has changed dramatically. We’ve shifted from monolith to microservices, from bare metal to VMs to containers to function-based computing — and it’s changed how we need to approach monitoring and observability.
This past November I spoke at OSMC 2019 about my experiences creating Sensu and what I consider to be the essential attributes of an effective monitoring pipeline. In this post, I’ll recap that talk and make the case for why you should be using Sensu’s observability pipeline — and why rolling your own solution from scratch is far too costly, from both a money and maintenance perspective.
Our shared reality as operators
The world of operations has grown steadily more complex over time: Applications are more complex, and the infrastructure they run on is equally so. As we’ve shifted from cloud to containers to function-based computing, the number of things we manage has also increased exponentially. Most medium-sized organizations now manage tens of thousands of machines; even something as seemingly simple as a small ecommerce app may require hundreds of services and microservices.
We’re also dealing with containers and functions that are extremely ephemeral, utilized one minute and gone the next. How do you observe something that’s so fleeting?
All of this complexity requires a paradigm shift in how we approach monitoring:
-
From host-based monitoring → to role-based monitoring, where we’re able to monitor and alert on certain actions and services, not just machines.
-
From remote polling → to publish-subscribe and push APIs, where we can funnel data into pipelines no matter its origin or format, rather than aggressively polling individual servers.
-
From point-and-click interfaces → to infrastructure as code, self-service, and developer-friendly APIs that align with modern DevSecOps approaches.
With Sensu, the concept of applying workflow automation to monitoring comes to life. We have pipelines for continuous integration and deployment, and now we have a pipeline for monitoring and observability.
The anatomy of a Sensu pipeline
Let’s take a quick detour to nearly 10 years ago, when my journey to build Sensu began. Back in 2010/2011, in the still-nascent days of cloud infrastructure, I was working at Sonian as an automation engineer and getting upwards of 45 pages on any given night. (The alert fatigue and sleep deprivation were real.) With a growing team and evolving software stack, we needed a tool that could monitor cloud infrastructure effectively, and no existing tool could.
I set out to create an agent-based monitoring system with auto-discovery that could self-register all of my monitoring agents and would meet the following requirements:
-
Handle ephemeral compute environments.
-
Operate securely on public networks like AWS.
-
Leverage familiar technologies, such as integrating with configuration management tools and working with existing service checks and Nagios plugins.
-
Scale horizontally.
-
Make use of APIs!! (Seriously, no monitoring tool in 2010 had an API.)
Sensu unifies the data collection and processing for any type of monitoring event — service checks, metrics, traces, logs, and inventory — and provides a simple set of components (what I called “primitives” at the time) which include event filters, event payload mutators, and event handlers. Event handlers take actions based on the response you dictate (e.g., sending alerts, writing data to a TSDB, triggering auto-remediation, etc.).
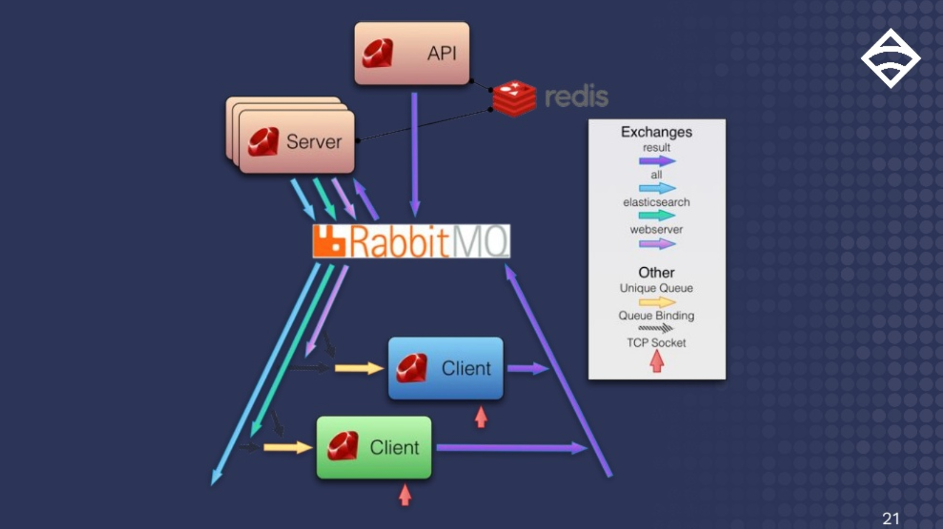 The first Sensu diagram I made in 2011. It shows the backend server (or scheduler, which can be scaled horizontally) that publishes check requests. The check requests move through to the clients that execute them and then push results back for processing.
There are two critical layers to Sensu’s monitoring pipeline:
- The data plane. Think of this like the body of the system: It’s the vessel responsible for loading data, transporting and routing, load balancing, and failover. This is the layer that developers traditionally interact with.
- The control plane. This is the brain of the system, composed of the orchestrator, configuration, security (auth), the APIs, agents, data processors, and anything else that informs the pipeline and tells it how to work. This is the layer that operators interact with.
If you’re confused by this jargon, watch this video by Microsoft and Hashicorp where they explain how data and control planes apply to service meshes. (A service mesh isn’t all that different from a monitoring event pipeline.)
And here’s more to the Sensu origin story if you want a deeper dive.
Sensu eliminates the need to build your own monitoring pipeline
The problems that I hoped to solve with Sensu are familiar to most of us. As operators, we need to get data from one tool, system, or format into another format, and we need to be able to do it across a multitude of tools, all of which are processing more and more data every day.
We’re creative people and we’re used to working within a bunch of constraints (e.g., budget, hardware availability, resources, time) to solve challenges that we may or may not have had any involvement in creating. So integrating a bunch of existing tools to solve your monitoring problems may feel like a natural extension.
A bespoke monitoring pipeline could look something like this:
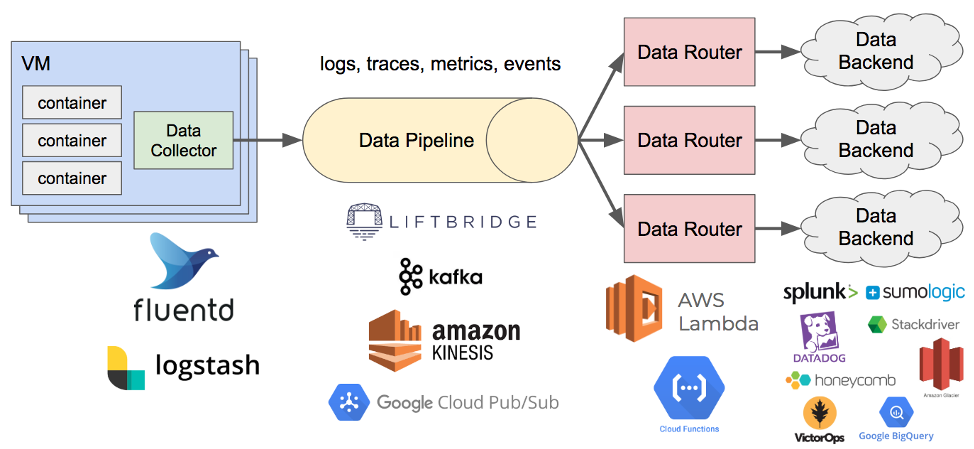 In this example, there’s a data collector that pushes data into a pipeline, maybe something like Kafka. There are several data routers processing the data with some sort of rules engine that then writes it to a data engine.
Here are just a few reasons why I think rolling your own pipeline backs you into a corner:
- Too many technologies at play. Cobbling all of these together on your own is daunting, and leaves too much room for error.
- Change becomes expensive. If you punch above your weight in terms of functionality, any change you want to make becomes time-intensive and costly.
- Not future-proof. How we deploy and manage infrastructure will continue to change, so you need solutions that rely on constants (e.g., fewer agents, fewer sidecars to support). A bespoke pipeline can become very complex, even antiquated, fairly quickly. (Not to mention, who wants to rebuild this from scratch when transferring to a new job or organization?)
- Maintenance costs. The need to maintain whatever you build might be the highest cost of all.
Of course, I also think it’s unnecessary to build your own pipeline when Sensu’s monitoring pipeline delivers the most modern and sophisticated approach — and believe me, we’ve discovered what makes for an effective monitoring pipeline after lots of trial and error.
Attributes of an effective monitoring pipeline
An effective monitoring pipeline needs to be simple yet flexible, giving people the ability to reuse and rebuild components as needed, within limits that help control sprawl and variance. The following attributes are essential:
1. A unified event payload (or set of payloads) with:
-
Unified data formats
-
Unique IDs - To identify where data came from, and its path through the pipeline.
-
The ability to capture context at collection time - To represent what happened during a single payload in order to triage issues and work through incidents.
-
Support for additional metadata - So developers can add tags and annotations to enrich the data for the operator on the other end.
-
Support for efficient debugging
2. A collection agent that:
-
Is lightweight - Think: minimal sidecars.
-
Supports multiple platforms - No matter if you’re using Linux, Windows, Solaris, or AIX, your agent should deploy consistently across everything.
-
Initiates connections to backends
-
Allows for bidirectional communication - So your control plane can sufficiently orchestrate things, install dependencies, publish-subscribe and pull objects.
-
Automatically registers and de-registers hosts - So you can monitor ephemeral infrastructure without getting overloaded with alerts.
-
Automatically discovers platform info, system details, and roles/responsibilities
-
Has a keepalive/heartbeat mechanism
-
Supports service check execution - Service checks are often underappreciated or even overlooked, yet they are a great way to leverage over a decade of investments.
-
Has a durable outbound data queue
-
Leverages several data inputs (APIs)
-
Supports industry standards - For metrics (StatsD, OpenTelemetry, Graphite), tracing (OpenTracing), and structured logging (JSON).
3. Data transport that supports:
-
Standard cryptography (TLS v1.2)
-
Standard protocol (HTTP) - To run a load balancer or application proxy and traverse complex networks.
-
Agent-initiated connections to the backend - So you’re not having to punch holes from the central DMZ to all of your separate datacenters.
4. A data processor that:
-
Scales horizontally
-
Has as little coordination with its peers as possible - To eliminate distributed problems.
-
Presents concurrency and parallelism - To process ever-growing amounts of data without running more and more machines.
-
Is easy to extend and integrate - Has simple APIs and clear specifications so everything can be easily maintained.
-
Provides RBAC to achieve multi-tenancy and self-service - Increasingly, operators have become a platform team for developers; you need to provide monitoring as a service so each developer or team gets the pipeline they need.

5. Filtering that lets you route data at a granular level. You need to be able to route data differently whether it’s related to incidents, resolutions, metrics, or applications in production. (Effective filtering is the secret sauce of the control plane!)
6. Transformers that process the data. An effective pipeline needs access to APIs and extensions that let you transform data from format A to format B efficiently, so no matter how much data you funnel into your pipeline, it’s processed it in a repeatable way.
7. Executable actions based on what you decide to do with your data:
-
Alert notifications
-
Incident management
-
Metrics and event storage
-
Inventory
-
Auto-remediation
With all of the above attributes in mind, here’s an example of the event monitoring pipeline in Sensu, which contains multiple pipelines within the primary pipeline:
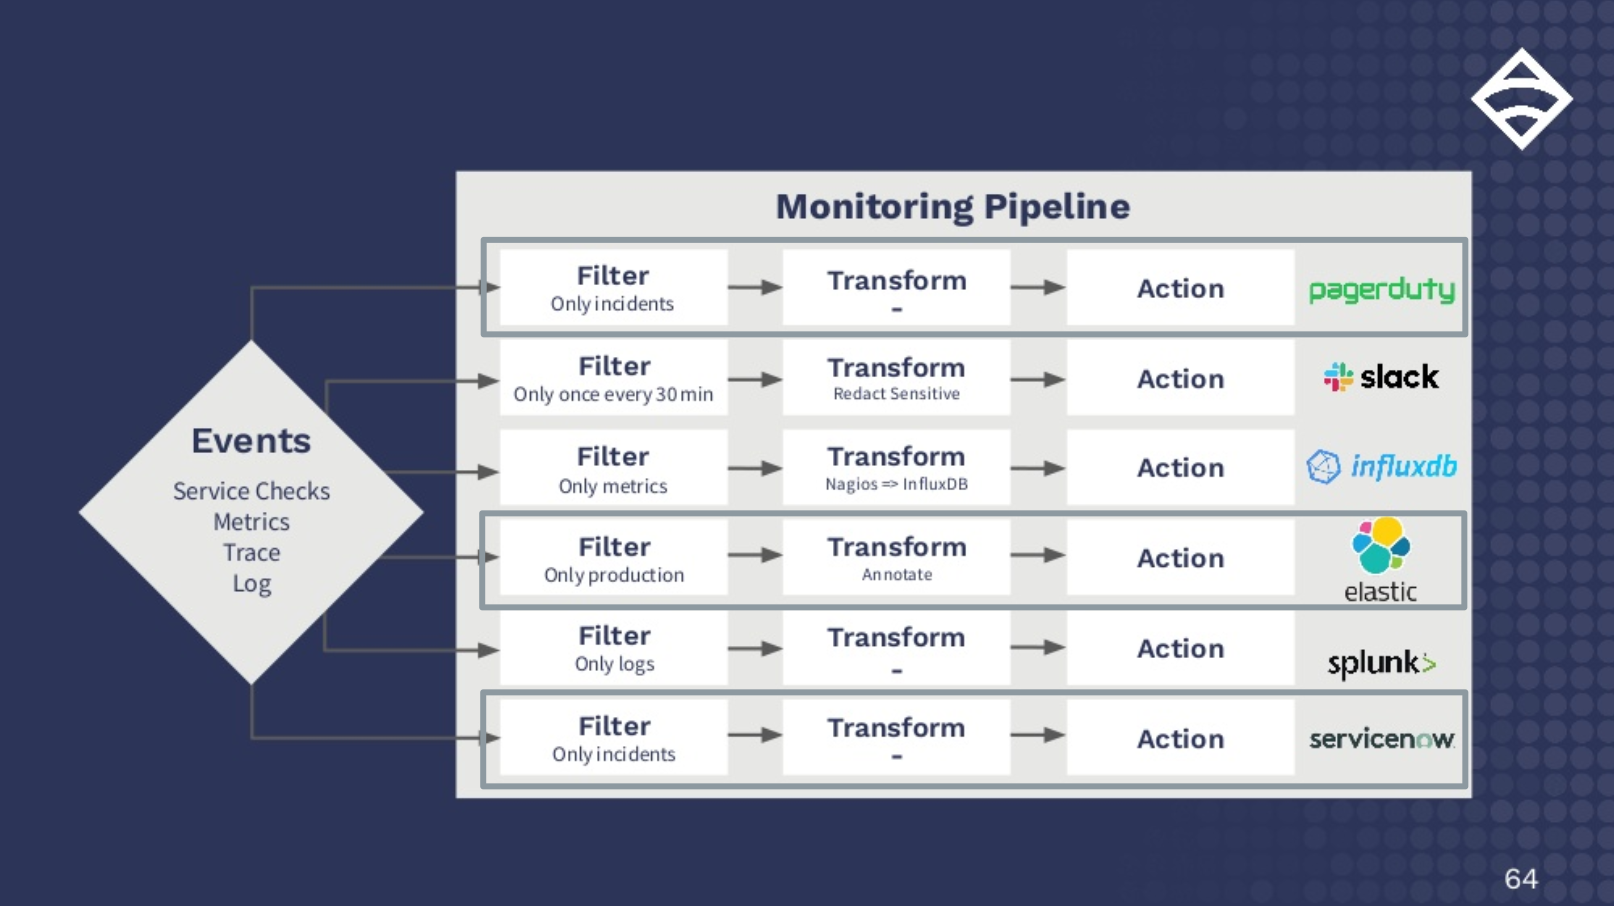 Let’s imagine a service check tells you a system in production is down. In this example, you’ve decided to handle an incident like this in three ways: 1) Pass the incident to PagerDuty, 2) Add annotations (e.g., which datacenter it’s from or which team is responsible) and write it to Elastic for reporting, and 3) Send it to ServiceNow as a high-priority task.
I hope it looks pretty straightforward — its simplicity and flexibility is by design (and stands in stark contrast to the bespoke pipeline we looked at earlier).
Sensu Go in action
I’ve got a few demos to share that show Sensu Go in action, highlighting the ease at which you can create your own pipelines. Check out the links below, or follow along on GitHub if you’d prefer.
In the first demo, I deploy an HA Sensu backend cluster and a simple web app with a load balancer. Then, with one command, I create a monitoring pipeline that has a check, a filter (in this case, a sensu-severity-filter for critical or warning alerts), and a handler (in this case, the sensu-pagerduty-handler) to monitor the health of the web app and send the incident to PagerDuty.
In the second demo, I create a pipeline using a filter plugin called sensu-fatigue-filter (that alerts on the first occurrence and then every 30 minutes after, which is great for when you’re sending details via SMS or email) and the sensu-slack-handler to notify within a Slack channel.
In the third demo, I show how you can create an InfluxDB pipeline for metrics using a built-in filter called has_metrics with the sensu-influxdb-handler. So if an event has metrics, it’ll go to this handler. I’ve created a check that’ll scrape the Prometheus endpoint on my app, then transform the data into a format the handler will understand, and send it to InfluxDB. Now you can monitor the uptime and health of the service, as well as measure runtime stats and application telemetry. (If you use Grafana — and why wouldn’t you? — you’ll also be able to visualize all of it.)
In the final example, I create a pipeline to store incidents in Elastic, where you’d then be able to generate SLA reports, outage reports, and the like.
All of these use cases are available in the GitHub repo, so you can start rolling your own monitoring pipelines right away.
The future of pipelines
Given my long history in the monitoring world, I often think about what could be on the horizon. Hopefully we’ll see fewer organizations getting trapped in the maintenance cycles of their own creations, and instead see teams using a common framework like Sensu and collaborating on shared assets and plugins, like the Sensu community does over on Bonsai.
I think we’ll also see pipelines become more observable themselves, even auto-suggesting their own improvements. We’ll certainly see more two-way integrations from other tools and providers, which means the possibilities are endless for how we conceive of — and interact with — the systems that drive end-user experiences.
If any of this excites you, you should give Sensu Go a try. Install it or download the Sensu Go sandbox, which comes pre-configured with InfluxDB and Grafana.


Made with #monitoringlove by SensuTM in Canada 🇨🇦 and the USA 🇺🇸. © 2017-2021 – Privacy Statement – Terms & Conditions