Sensu Summit 2019 featured talks from the Sensu Community, including Harvard University SRE Molly Duggan, who shared how the Harvard FAS Research Computing Department uses CI/CD pipelines and the Sensu Go API to automate monitoring for their highly complex infrastructure.
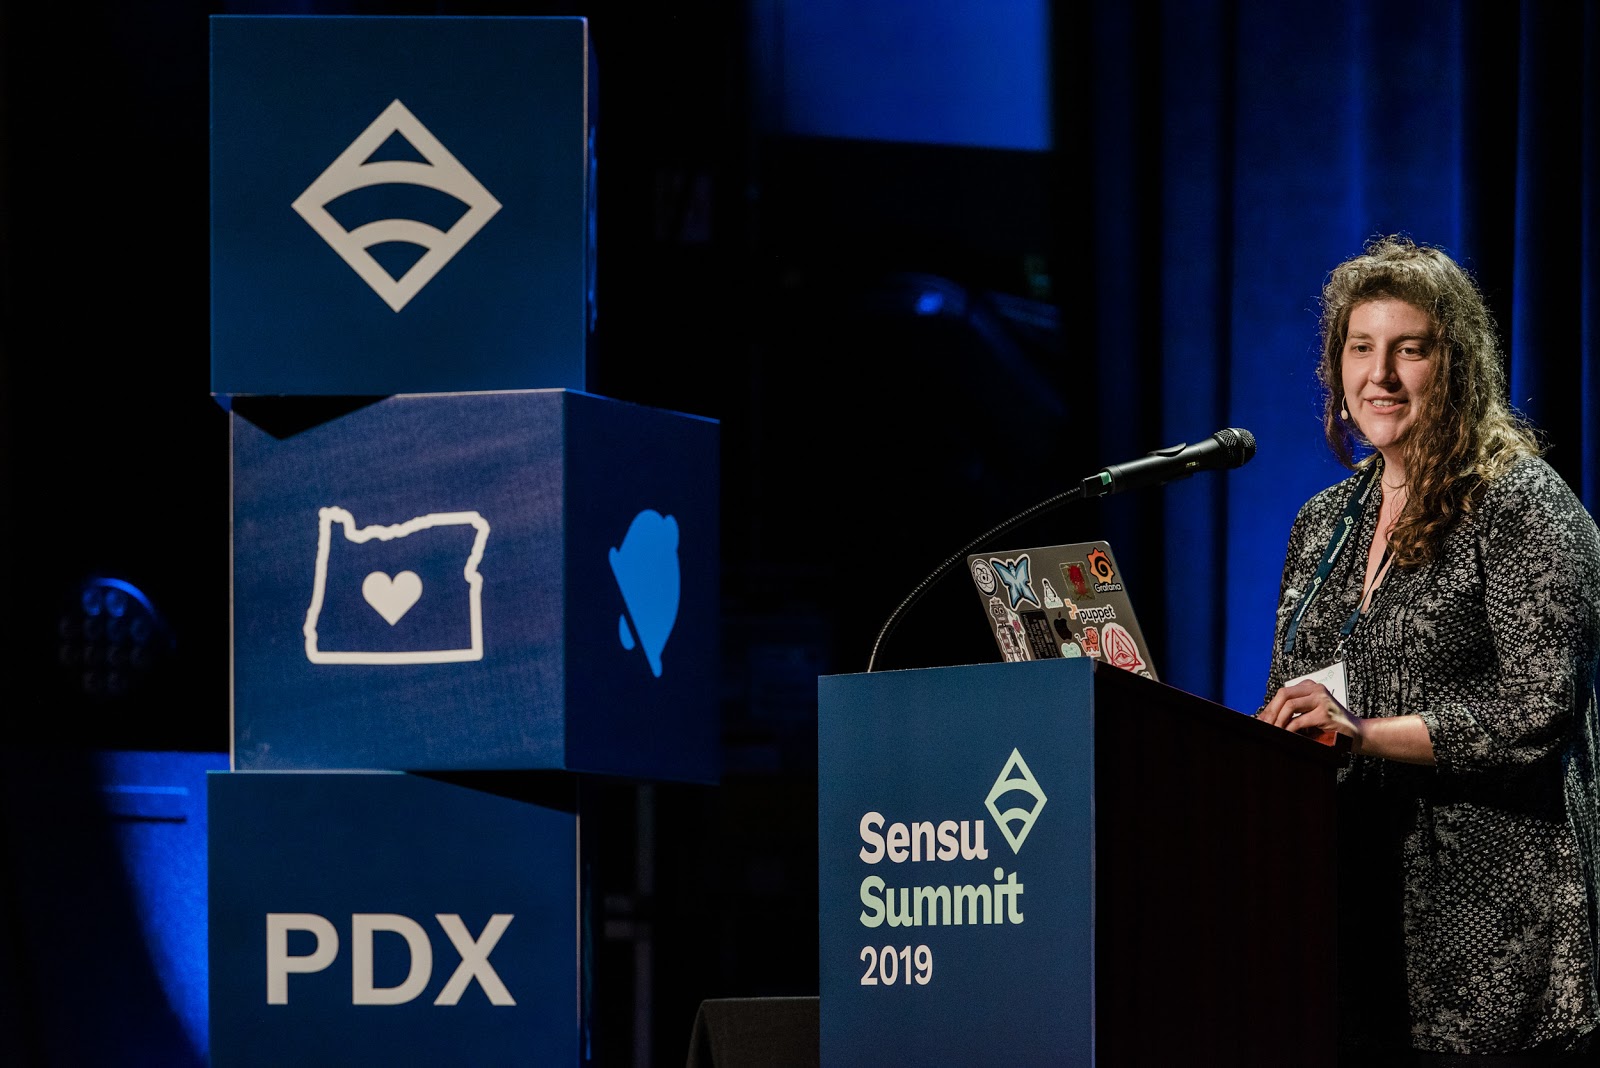 Harvard’s Molly Duggan at Sensu Summit 2019: “Nobody accumulates cruft like a university that’s been there since the 1600s.”
In this post, I’ll recap Molly’s talk, with details on why Harvard chose Sensu Go, how they achieved a CI/CD pipeline for monitoring, and a couple of demos.
Site reliability engineering at Harvard
Harvard’s Research Computing Department provides high-performance computing services for the university’s researchers in sciences, social sciences, and humanities — a network of academics that have various needs and aims. As such, the department has “all sorts of oddities to deal with [in terms of infrastructure],” says Molly.
Their infrastructure serves over 500 lab groups and 5,500 users, and includes:
- A cluster of 100,000 CPU cores that runs 29 million jobs per year
- 40PB of storage used for running compute jobs, storing backups of lab data, and more
- Two data centers
- Private cloud services using OpenNebula that provide:
- Connected VMs so researchers can share their research with the public
- Multiple databases for the researchers and university museums
- The department’s own services (Puppet, Gitlab, etc.)
University life also means an over-accumulation of special snowflakes. Molly explains, “There are 1,800 [compute nodes] that are all the same, and everything [else], well, there’s nothing like it.”
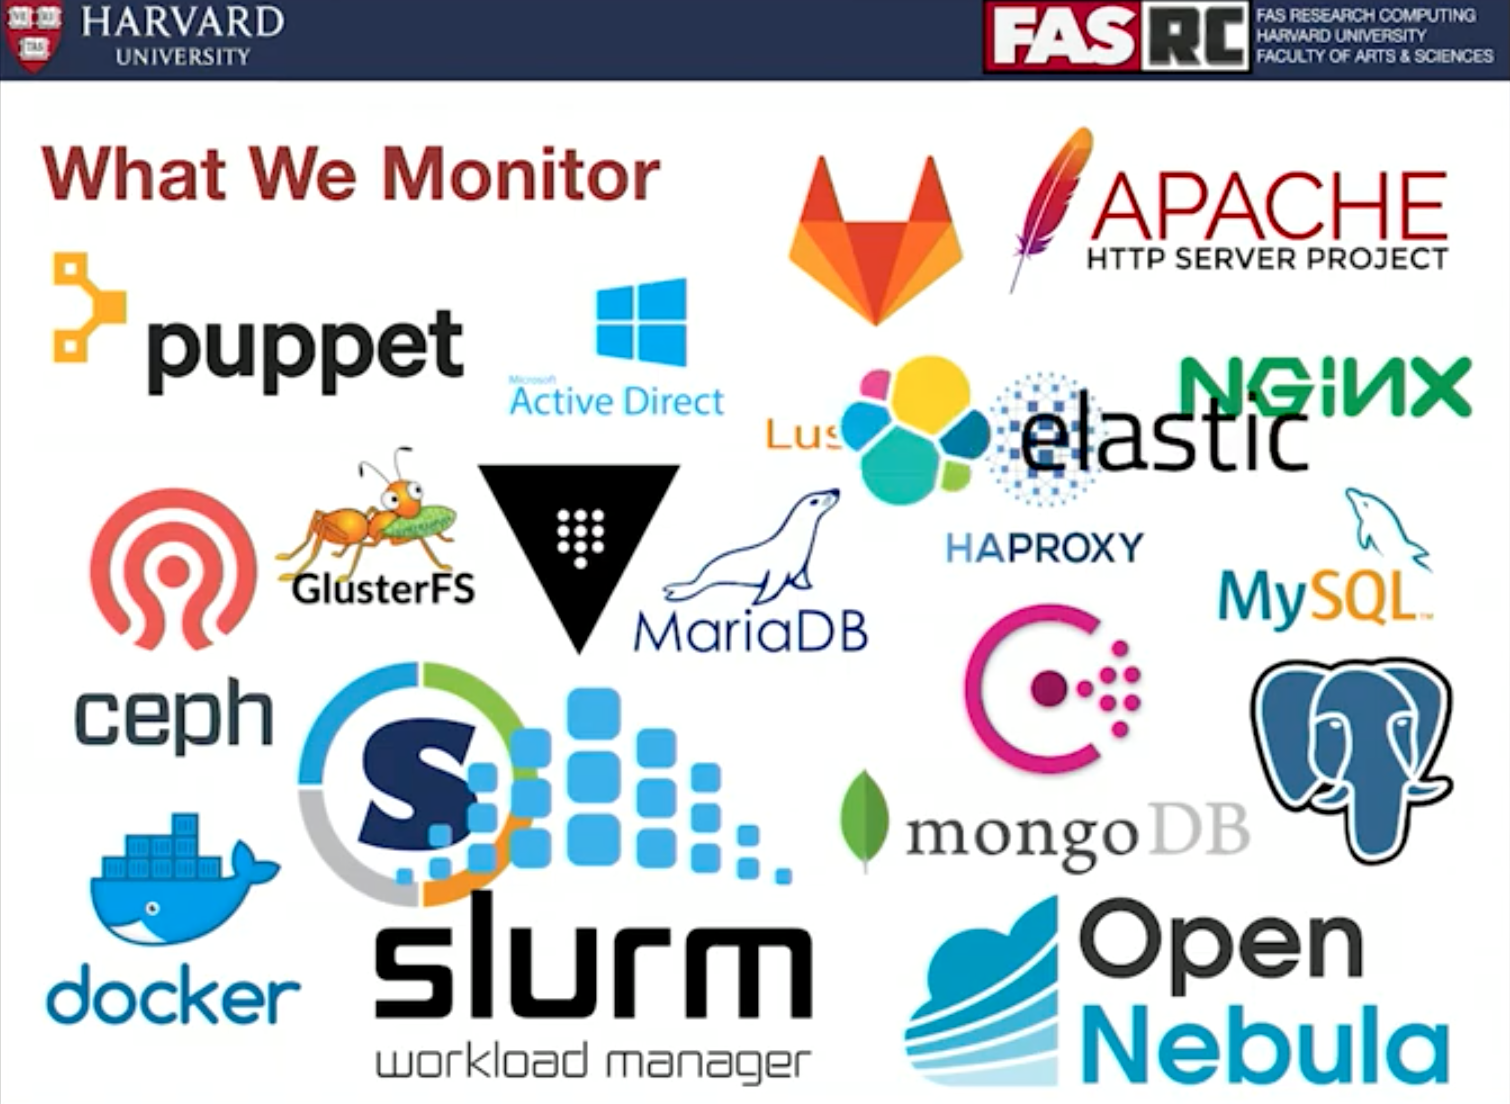
Molly’s team is responsible for monitoring all the things, including:
- Puppet
- Gitlab
- Active Directory
- Containers (Docker, Singularity)
- Web servers (Apache, Nginx)
- Load balancers (HAProxy)
- So. many. databases. (MySql, Maria DB, PostgreSQL, mongoDB)
- File systems that are specific to high-performance computing (Luster, Gluster)
- Cloud services (OpenNebula)
- Ceph (which underlies their OpenNebula infrastructure and is used for block storage)
- Slurb (a job scheduler that allows researchers to run code on their cluster)
- Secrets managers (Vault, Consul)
- Log analysis (Elastic)
 All the things.
If it seems like a massive undertaking, Molly tells the audience: “Really, this is fine. It’s ok. It’s completely under control.” Enter dazed dog in burning house.

So, yes. There’s a lot of complexity here.
Molly says, “I really wanted to provide sanity to this because, as far as SREs and DevOps, [there are only three of us] on the software infrastructure team. None of us are going to be experts in the Luster file system the way some of our Luster experts are. None of us are going to be able to write checks for something like the workload manager.”
When it came to choosing a monitoring solution, Molly needed a way for practitioners to provide their own self-service workflows. And she wanted to make sure everything stayed organized and on record.
Evaluating options for monitoring
The team originally evaluated three separate paths, each with its own drawbacks:
- Manual configurations with backups - This aligns with what the team does with PagerDuty, allowing practitioners to configure it themselves. The idea to manually configure monitoring was abandoned fairly quickly as it would cause too much of a free-for-all. It wouldn’t be easy to track changes, and it would be too hard to roll back to a known good state.
- Configuration management solutions - Configuring Puppet as a monitoring tool had potential because the team was already using Puppet, but they realized they didn’t want to throw every monitoring configuration into a repo that was already massive.
- Scripting using sensuctl - Sensu’s command-line tool was an option, but it wouldn’t provide the self-service they needed. The team wanted to make it easy for practitioners to write their own checks and get them up and running quickly.
The solution: Sensu Go + Hinoki
Ultimately, to achieve the flexibility and portability they needed, Molly’s team chose Sensu Go alongside custom code they wrote called Hinoki, a command-line tool that helps them manage Sensu configurations by importing definitions via the Sensu API, and shipping and packaging assets.
Molly says, “[Sensu Go and Hinoki] hook right into our CI/CD pipeline… [Hinoki] relies on a specific folder structure for defining all of our Sensu things (asset definitions, check definitions) because, in part, I wanted to enforce this and keep it sane for users. Everything has to stay in a place that makes sense.”
Using Sensu Go with Hinoki brings order to their monitoring ecosystem by providing these advantages:
- An easy audit trail - Sensu checks are easy to find and are located in their own repository.
- Self-service - Team members can contribute their own checks via a git push, and they can see who changed code via a git blame.
- Lots of flexibility - The team has a framework for API calls, and can easily add working code to the code base.
In the end, the team achieved a CI/CD pipeline with Sensu Go that ensures changes to their monitoring system are validated, reproducible, and version-controlled.
To get a better idea of how it works, let’s see some demos of Sensu Go and Hinoki in action.
Demo 1: Updating settings
The first demo shows how to execute changes in the CI/CD pipeline. In this example, Molly initiates a configuration change for Ceph, updating the schedule to a shorter interval.
Demo 2: Deleting everything
In the second demo, Molly illustrates how to delete everything in Sensu and start from scratch, an exercise that proved useful during testing and building phases when her team needed a clean slate.
After clearing out Sensu and etcd, she runs a Hinoki import to pull down all of the checks from her repo and populate them back into Sensu.
Hinoki is open source and on GitHub, so you can start automating your own monitoring configurations.
Ready to start using Sensu Go? Get started here.

Made with #monitoringlove by SensuTM in Canada 🇨🇦 and the USA 🇺🇸. © 2017-2021 – Privacy Statement – Terms & Conditions