As my co-founder Caleb Hailey likes to say, collecting monitoring and observability data is essentially a solved problem. The only remaining challenges are related to getting that data where you want it to go. When dealing with different formats — say, collecting Prometheus metrics and storing them in Elasticsearch — this can be a non-trivial problem. Put simply, it’s like trying to put a square peg into a round hole.

At Sensu, our focus is to make it easier for you to get your data where it needs to go. As of Sensu Go 6.1 — now available to download — it’s easier than ever to collect Prometheus metrics and send them to the database of your choosing!
In this post, I’ll share a brief history of Prometheus and Sensu, an overview of the new Prometheus transformer, and a demo of how it works.
Prometheus metrics and Sensu: a brief history
Our motivation for incorporating Prometheus metrics scraping into the Sensu product is multi-fold: the Prometheus Exposition Text Format is an industry standard for representing telemetry data, and the Prometheus ecosystem provides a number of metric exporters — services that collect, compute, and expose metrics in this format. As such, being able to scrape Prometheus metrics has always been part of Sensu’s functionality. Sensu Classic users might recall the Sensu Prometheus Collector, which was a check plugin for scraping Prometheus metrics. Now, scraping and extracting Prometheus metrics is a core part of the Sensu product.
And while Prometheus is often the go-to solution for monitoring Kubernetes, the fact that the Prometheus data collection model defaults to time series is a double-edged sword: while standardizing how you collect data can simplify matters, you also might be missing out on context due to the inherent constraints of a pure-telemetry data model.
We want to give you the best of both worlds. By pairing Sensu and Prometheus, you can benefit from:
- Service health checks and metrics, AKA, filling the gap in a purely telemetry-focused approach.
- Workflow automation for monitoring, automating what you can, and saving alerts for tasks that can’t be automated.
- More context, enriching telemetry data with all the information about your system on which you’re running a Sensu agent.
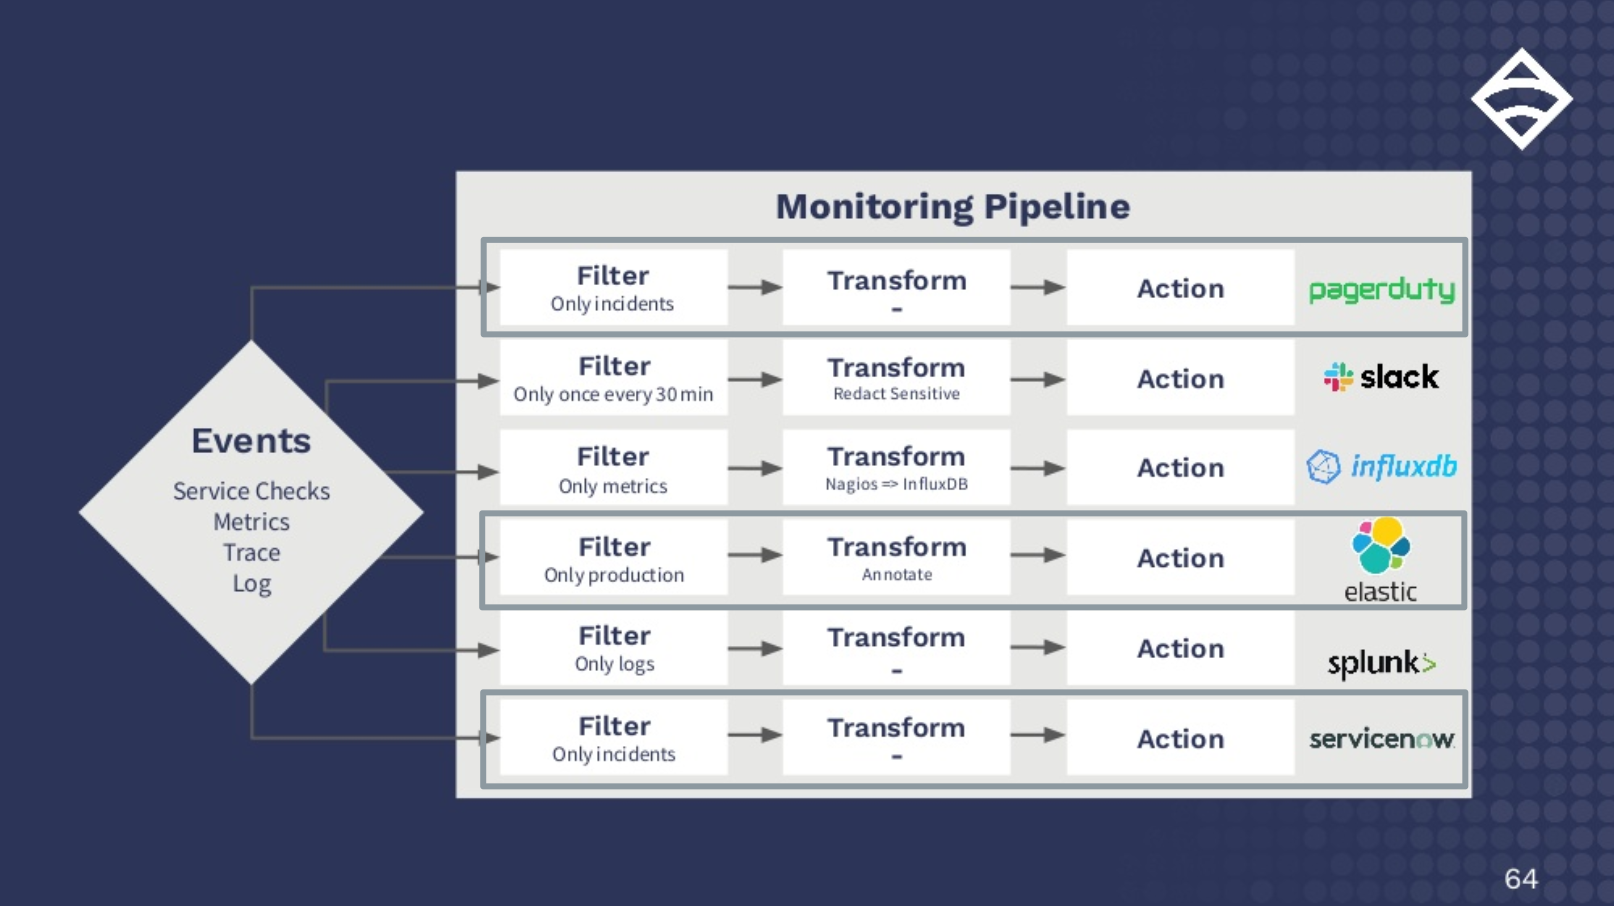
- Increased flexibility, with more ways to get data into Sensu. You can benefit from the Prometheus instrumentation libraries while processing and storing data in InfluxDB, Elastic, Splunk, or whatever database you’re using.
- Industry standard cryptography for communication, allowing you to collect and transmit data securely, without having to punch holes in your firewall.
Using Sensu and Prometheus together means you don’t have to compromise (i.e., try to fit a square peg into a round hole). With Sensu, you can collect data in a variety of formats and send it to your database of choice for easier analysis and simplified operations.
The new-and-improved Prometheus transformer
As noted earlier, Prometheus output extraction is now a core part of the Sensu product, meaning it’s easier than ever to scrape Prom metrics and transform them into the format required for your database of choice.
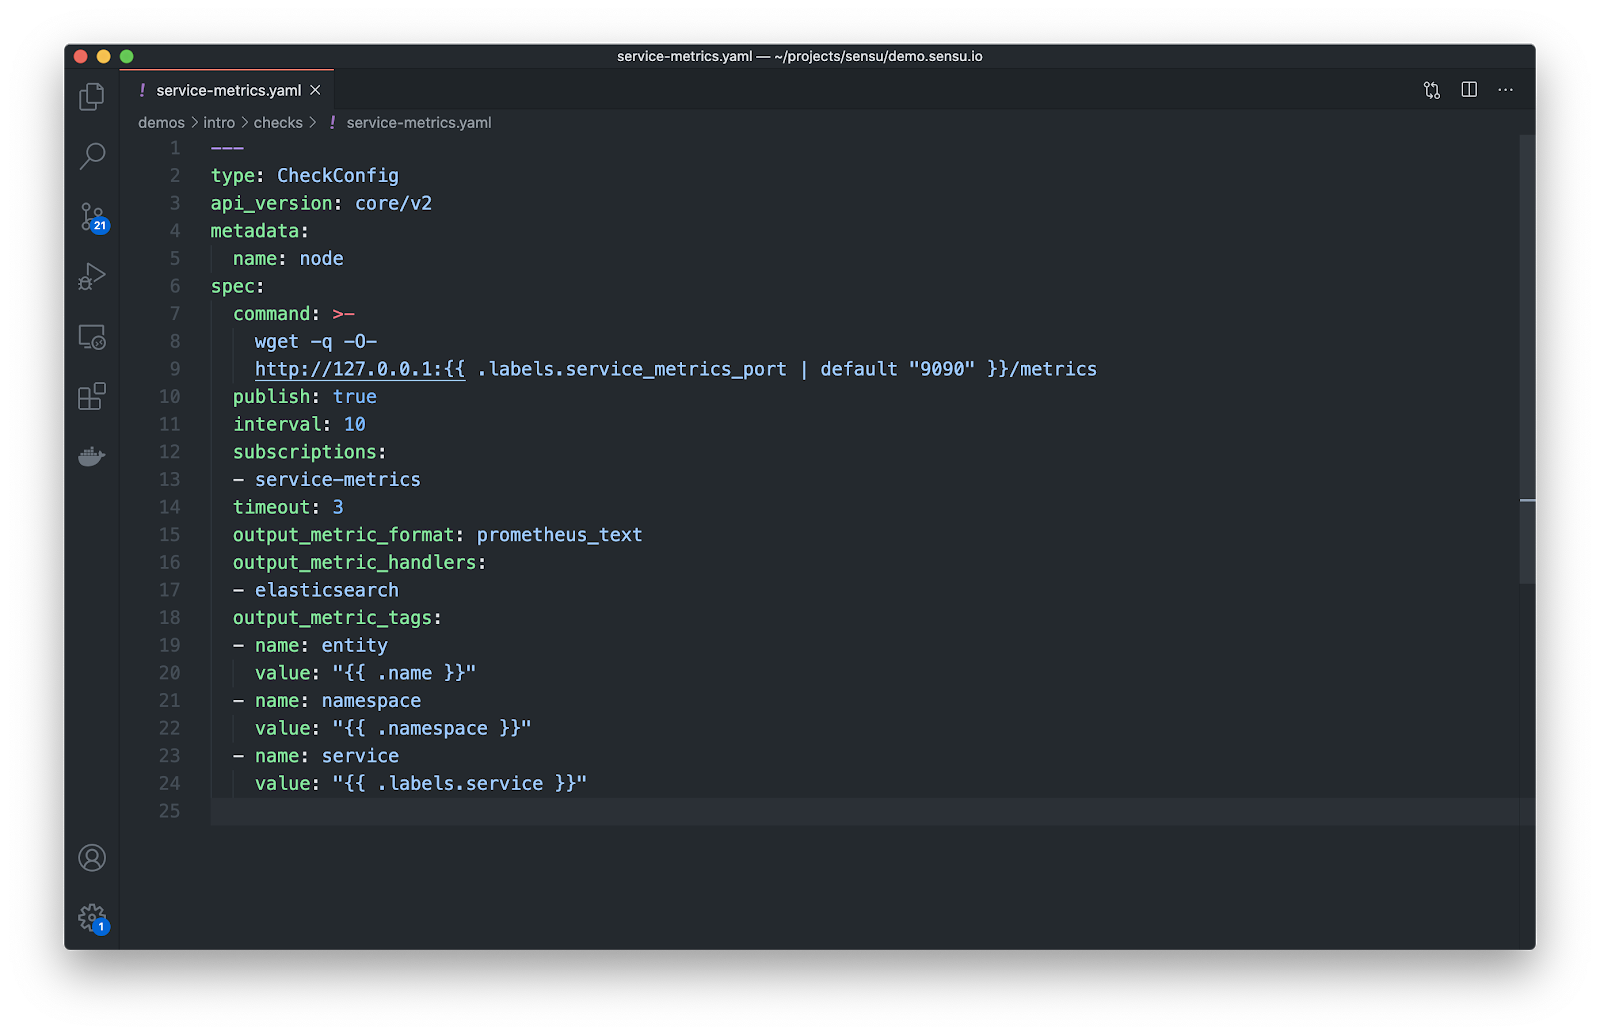
With Sensu Go 6.1, we’ve added native support for parsing Prometheus Exposition Format metrics, so you can scrape a Prometheus endpoint and use the output_metric_format transformer to convert the metrics into the Sensu Go event metrics format. You can also enrich collect metrics with additional tags using output_metric_tags.
Here’s an example check definition that shows how you’d scrape Prometheus metrics and transform them into the Sensu Go metrics format so it can be sent to Elasticsearch, using output metrics tags to enrich the data:
Want to learn more about getting your monitoring and observability data into Elasticsearch? Watch our webinar, in which we illustrate how to get various metrics and data sources (like Prometheus metrics!) into Elasticsearch.

Over to you
We hope these updates make it easier than ever for you to get more context and gain deeper visibility into your infrastructure. To start sending your Prometheus metrics to your favorite database, simply download the latest version of Sensu. Give it a try, and let us know what you think by joining our Community Forum, below!

And stay tuned for our next post, in which we’ll discuss how to collect Prometheus metrics from services running on Kubernetes as well as Kubernetes itself.
Related Posts
Observability Pipelines: Why you need one, and why you should stop rolling your own
Why you should be using Sensu’s observability pipeline — and why rolling your own solution from scratch is far too costly."> <meta name="generator

Monitoring Kubernetes + Docker, part 3: Sensu + Prometheus
Monitoring Kubernetes, addressing some of the cons of Prometheus, showing how Sensu and Prometheus form a complementary solution.

The key to multi-cloud success
While it’s clear that a multi-cloud strategy offers many benefits and flexibility for an organization, there are also more moving parts to track (with the added challenge of hybrid, multi-generational infrastructure)

Made with #monitoringlove by SensuTM in Canada 🇨🇦 and the USA 🇺🇸. © 2017-2021 – Privacy Statement – Terms & Conditions