I recently gave a talk at GrafanaCon LA, which was heavily inspired by my blog post on check output metric extraction. During the talk, I dove into a popular monitoring use case with Sensu, InfluxDB, and Grafana — let’s call it the SIG stack 😎. While I got to share some awesome features in Sensu that ultimately allow users to collect, store, and visualize their metrics, the conference was about Grafana, and folks wanted to see dashboards! Now, I’m a Go dev, not a data scientist, so I don’t have quick access to large sample sets, and while it’s super easy to spin up Sensu in production and start scraping nodes to collect fancy metrics, I wanted something more… and the attendees of GrafanaCon wanted something moar!
StatsD

Enter StatsD, the OG metric aggregator that — over the years — has become an industry standard. It’s a simple and lightweight daemon that can aggregate custom performance data. StatsD client libraries are ubiquitous and available in just about every language, so you can instrument the tooling in your app’s native language and send those metrics off to a StatsD server. Fortunately for you, every Sensu agent has an embedded StatsD server that listens for UDP traffic on port 8125. Since UDP is a “fire-and-forget” protocol, that minimizes performance impact and risk when implementing it in your code.
Dogfooding

“Eating your own dog food” — or as we like to refer to it internally at Sensu (for obvious reasons), “drinking your own champagne” — is a great way to test your product using real-world scenarios. I decided to dogfood Sensu by leveraging an existing Golang/StatsD client library into our own API code (I used alexcesaro/statsd as my open source solution). Doing so is as easy as instantiating the client and incrementing a counter!
// Connects to localhost UDP port 8125 by default
c, err := statsd.New()
if err != nil {
    // Log a debug message if you want, but no other cleanup is necessary.
    // The client will just quietly fail and won’t impact your app.
    logger.WithError(err).Debug("statsd r u ok bro?")
}
defer c.Close()

// Increment a counter with whatever custom metric you choose
c.Increment("count.chocula")
Note: To configure the StatsD server address, you can simply use statsd.New(statsd.Address("192.168.0.5:8126")). However, if you’ve made it this far, it’s likely that you have a Sensu agent installed on the same instance that’s running your app, so it’ll already be listening to the defaults.
HTTP middleware
In order to track every API call, we need to increment a counter on each API request. The easiest way to do that in Go is with HTTP middleware (code that is run before and/or after the HTTP handler). In Go, it’s a common practice to format the middleware to accept http.Handler as a parameter, and return http.Handler. Additionally, the HTTP handling code, http.HandlerFunc, should abide by the signature (w http.ResponseWriter, r *http.Request). The net/http package is critical to developing Go APIs, so definitely read up here for more information. To simplify, here’s what a middleware should look like:
// Then middleware
func Then(next http.Handler) http.Handler {
    return http.HandlerFunc(func(w http.ResponseWriter, r *http.Request) {
        doSomethingWithRequest(r)
        next.ServeHTTP(w, r)
    })
}
Note: Sensu Go uses middleware for many different purposes such as authentication, authorization, and logging. You can check out sensu-go/backend/apid/middlewares to see some more examples in action.
30 lines or fewer

So now that we know how to start a StatsD client, increment counters, and write middleware… let’s put it all together! The counter will contain the request method and URL path, removing the leading / of the path in this example. The notation method.path is simple, and will be very friendly for customizing and analyzing the time-series data.
// StatsdClient is an HTTP middleware that sends counters and timers for each
// API endpoint to the local statsd daemon.
type StatsdClient struct{}

// Then middleware
func (s StatsdClient) Then(next http.Handler) http.Handler {
    return http.HandlerFunc(func(w http.ResponseWriter, r *http.Request) {
        c, err := statsd.New()
        if err != nil {
            logger.WithError(err).Debug("statsd r u ok bro?")
        }
        defer c.Close()

        c.Increment(fmt.Sprintf("%s.%s", r.Method, r.URL.Path[1:]))
        next.ServeHTTP(w, r)
    })
}
In the Sensu Go API, I can simply add the StatsdClient middleware to the NewSubrouter() function. However, in a more simplified approach, you’ll want to mount this middleware onto a parent or sub router, and have a HTTP server invoke it. Gorilla/mux is a great resource for that:
// Instantiate a router
router := mux.NewRouter()
// Add routes as needed
router.HandleFunc("/health", healthHandler)
// Mount the middleware
router.Use(StatsdClient{}.Then)
// Serve the router
log.Fatal(http.ListenAndServe("localhost:8080", router)
Lastly, make sure your Sensu agent invokes a TSDB with the configuration option statsd-event-handlers (my favorite is the sensu-influxdb-handler).
Voila!
Assuming you’re familiar with the SIG stack, we can start to visualize the data that the StatsD middleware is pushing. An example counter metric from dogfooding the Sensu Go API might look like this: GET.api-core-v2-namespaces-default-checks.value or GET.api-core-v2-namespaces-default-checks.per_second. Since you’re tracking API calls in a time-series database, you’ll not only have access to total request counts, but additionally any analytics such as requests per second. Play around with those InfluxDB x Grafana queries until you land on a sleek dashboard that provides custom visibility into the performance of your application and infrastructure, such as this one below:
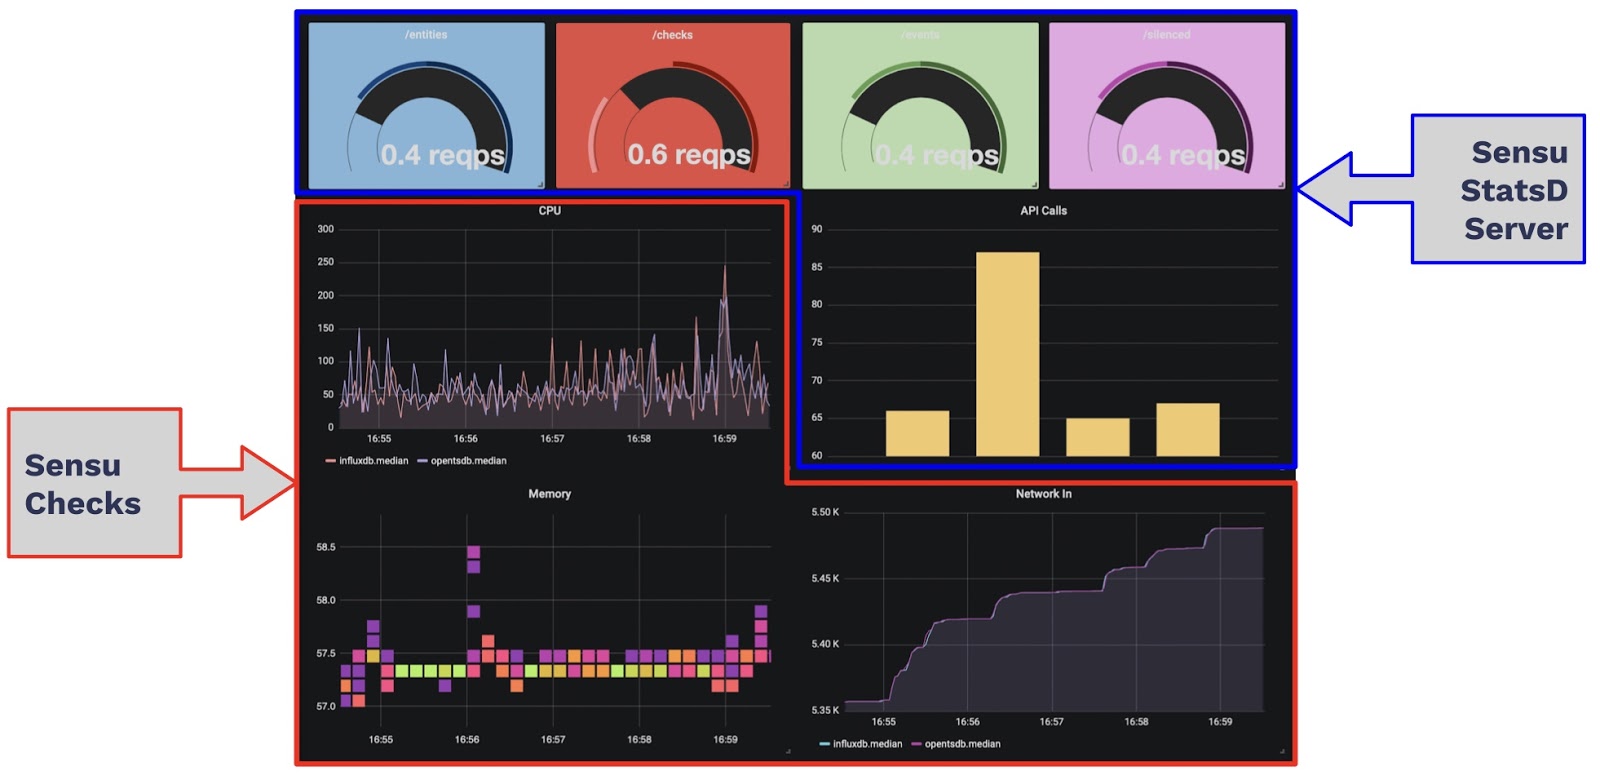
During the GrafanaCon announcement of Grafana 6.0, they introduced Gauges as their own panel. Rather than using the Singlestat panel to visualize a Gauge (pictured above), v6.0 decouples the Gauge module and adds a custom Threshold editor for the metric. Let’s just hope you have some alerting set up in your pipeline to notify you when requests rates exceed that threshold! If you’d like to continue down the monitoring and alerting rabbit hole, see the additional resources below.
Additional resources
Related Posts
Visualizing Sensu Go data in Grafana
The Sensu Go data source for Grafana allows you to display the data collected by Sensu Go together with a wide range of other data on a single Grafana dashboard. Here's how to set up and use it.

Check output metric extraction with InfluxDB & Grafana
With Sensu’s robust event pipeline, you can cater different methods of metric analysis for application performance monitoring, system metrics and telemetry data, & metric aggregation.
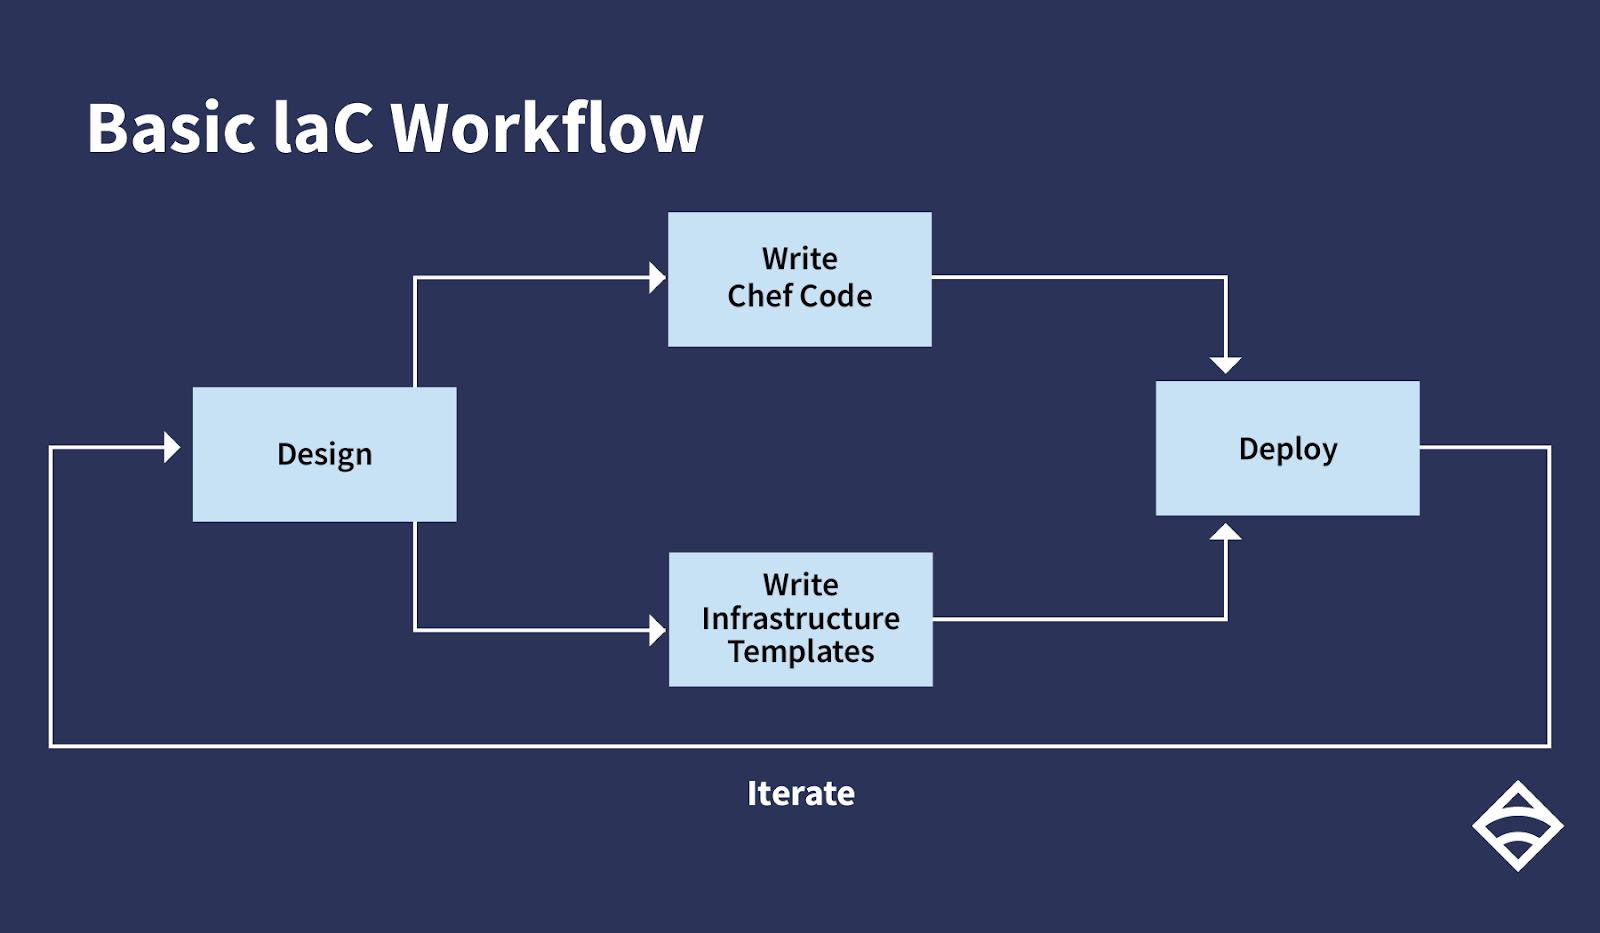
Infrastructure as code: testing and monitoring
Implementing IaC isn't enough; you must also continuously test and monitor your deployments, unlocking your potential to move faster, safely.

Made with #monitoringlove by SensuTM in Canada 🇨🇦 and the USA 🇺🇸. © 2017-2021 – Privacy Statement – Terms & Conditions